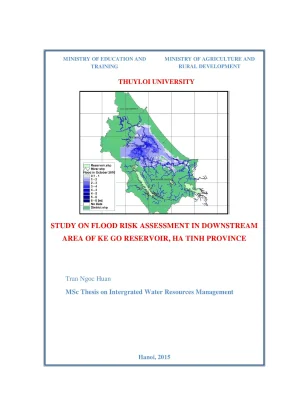
MINISTRY OE EDUCATION AND MINISTRY OF AGRICULTURE AND TRAINING RURAL DEVELOPMENT THUYLOI UNIVERSITY Reservoir.shp lood in October 2010 District.shp STUDY ON FLOOD RISK ASSESSMENT IN DOWNSTREAM AREA OF KE GO RESERVOIR, HA TINH PROVINCE Tran Ngoc Huan Hanoi, 2015 MINISTRY OF EDUCATION AND MINISTRY OF AGRICULTURE AND TRAINING RURAL DEVELOPMENT rrr 1959 Tran Ngoc Huan STUDY ON FLOOD RISK ASSESSMENT IN DOWNSTREAM AREA IN KE GO RESERVOIR, HA TINH PROVINCE Major: Intergrated Water Resources Management THESIS OF MASTER DEGREE Supervisor: Asso. Pham Thi Huong Lan This research is done for a partial fulfilment of the requirement for Master of Science Degree at Thuyloi University This Master Programme is supported by NICHE — VNM 106 Project Hanoi, 2015 Abstract Flooding causes economic, social and environmental damages and life loss. This fact increases the great attention on flooding by government, and science in many countries around the world. As a country located in the tropical climate region, Vietnam has been facing various water related disasters since ancient time, particularly in central parts of Vietnam where featured by steep topography.
In recent years, Rao Cai river basin in Ha Tinh province is frequently flooded due to climate change impact, rapid infrastructure and urbanization growth. This problem caused serious damages to human life, properties, and social — economic development activities. Flood risk management is a new concept based on a proactive approach which recently becomes a robust tool for reducing flood damage. Main contents of flood risk management are flood risk assessment and flood preventive measures or flood preventive planning.
Flood risk assessment is key part in flood risk management. Flood risk assessment is a function of three main variables: flood hazards, vulnerability, and coping capacity. Understanding of flood hazards, vulnerability, and coping capacity is the vital step for efficiency of flood risk assessment. Flood risk management strategies have not been developed for Rao Cai river basin for many years and there is no spatial planning approach for regional development.
This research aims at flood risk assessment for Rao Cai river basin based on the new concept of flood risk management mentioned above. An incorporated hydrological modeling approach for hazard assessment for Rao Cai river basin has been adopted in this research. The research objective divides into three parts: (1) Identification of flooding and potential reasons based on available natural, social and economic data; (2) The second part involved flood simulation and inundation mapping of events with chosen return periods using a MIKE package model (MIKE UHM, MIKE 11, and MIKE 11 GIS).The model was calibrated and verified based on the data series in October, 2010. A flood from 24 to 6" October 2010 was used to calibrate the model.
Another flood in October, 2010 (from 14” to 19", October) was used to verify the model. Results of calibration and verification were fit to measured data. The flood simulations for selected return periods were generated for 200 and 1000 years corresponding to frequency of design and checking flood of Ke Go reservoir. (3) Flood risk assessment is combined effect of flood depth (hazard factor) and population density (vulnerability factor) by weighing factors for both of them.
As for the results, the research revealed that flood risk assessment is helpful tool for flood risk management. Flood risk maps were produced for the flood of 1000 year and 200 year return period. The level of hazard and risk were determined for each community in Cam Xuyen, Thach Ha and Ha Tinh city. These maps can be used for flood risk management and mitigation planning for Ha Tinh province in general, Rao Cai river basin in particular.
Declaration Thereby certify that the work which is being presented in this thesis entitled, “Study on flood risk assessment in downstream area in Ke Go reservoir, Ha Tinh province” in partial fulfillment of the requirement for the award of the Master of Science in Integrated Water Resource Management, is an authentic record of my own work carried out under supervision of Asso. Pham Thi Huong Lan. The matter embodied in this thesis has not been submitted by me for the award of any other degree or diploma. Date: February 15, 2015 Tran Ngoc Huan Acknowledgements I would like to express my sincere gratitude to my advisor Asso.
Dr Pham Thi Huong Lan for her guidance, suggestion and inspiration. I would also like to acknowledge Dr. Vu Thanh Tu, Mr Duong Hai Thuan and Dr. Bui Du Duong for their comments and suggestion.
I would like to thank the Hanoi University for Natural Resources and Environment, Ministry of Natural Resources and Environment, Vietnam and NICHE — VNM 106 Project for the award of a scholarship and also Hanoi Water Resources University for giving me the opportunity for this special study. I also wish to thank members of the master thesis committee consist of Prof. Nguyen Quan Kim (chairman), Asso. Mai Van Cong (examination), Asso.
Nguyen Mai Dang (examination), Dr Le Viet Son and Dr Dinh Thanh Mung for their comments, examination, and corrections. Finally, I would like to express my special appreciation to my friends and colleagues for their supports, encourages and advices. The deepest thanks are expressed to my family members for their unconditional loves. TABLE OF CONTENTS CHAPTER 1 - INTRODUCCTION.
Problem Sfa†€TmTI.-- G- G131 90g HH ni ng | 1.- HH TH HH HH cờ 3 1. Structure Of thesis 1n. 3 CHAPTER 2: LITERATURE REV | No c0 0000000900 5 2. Concepts of flood risk, hazard and vulnerabiÏIty.
Flood risk aSS€SSTT€TIE. Previous Studies in Study AT€A.- - 2c 111193119 1v vn HH kg rry 9 CHAPTER 3: DESCRIPTION OF STUDY ARREẺA. c1 3101113111891 1 911 11 11191 1H vn ng ng nếp 10 3. Location of this DaS1T1.
0 1H ng ng nh ng gà 10 3. Hydro-meteorological characteristics. cece eee eeeeeecesseeeeeeeeseeeseeeeees 12 3. Social and economic Characteristics.
Rural area oo. Reservoir and current irrigation SS(€T. Overview Of Ke Go T€S€TVOIT. Ác vn HH ngư 18 3.
Flooding situation 1n downstream aT€a. The flooding events occurred 1n 20 Ï(. The flooding events occurred 1n 2 Ï2. The flooding events occurred 1n 2 TỔ.- -- -- 5< s + *sseexeeeeseeeress 26 CHAPTER 4: METHODOLOGY AND DATA USED.
Methods to flood risk aSS€SSINTIL. Method for estimating design hyetograph.- - ---«+s«ss++sessserssses 30 il 4. Method for developing design hydrograph on lateral flow in downstream Ộaiiiiiiắảáaáăắaẳ. Method for simulation floods corresponding to various return period.
Method for inundation mappInE. Governing equation in MIKE paCKaỹ©. Rainfall runoff model (MIKE - Unit hydrograph model). Identification of inundation MAPS .3, Data USC mẽ.
LH HH TH TH HH HH 36 CHAPTER 5: RESULTS AND DISSCUSIONS. The reasons cause the flooding in downstream area. Climate change 1InpDACES. 5 1E nh ng ng tư 40 5.
Infrastructure impact nh ae. Rainfall runoff mod€Ï1Tng. Flood risk in downstream area of the Ke Go T€S€TVOIT. s52 65 CHAPTER 6: CONCLUSIONS AND RECOMMIENDATIONS.-- --- c1 93019111911 11910119 nh HH nh nh 71 REEERENCES.
co (G5 cọ HH. Go 0 ee 76 Appendix 1: Frequency curve of maximum rainfall during | day of stations. 77 Appendix 2: Roughness CO€fTICI€TIE.-- 5 cv ng ng giết 81 LIST OF TABLES ‘Table 3- 1 Lists of meteorological stations 12 ‘Table 3- 2: The average of monthly rainfall at Ha Tinh station from 1975 - 2010 .14 ‘Table 3- 3: Monthly discharge of Ke Go reservoir from 1957 - 2010, 1s ‘Table 3- 4: Population pattern. 16 ‘Table 3- 5: Land use.
lụ ‘Table 3- 6: Technical parameters of reservoir 19 ‘Table 3- 7: Parameters of junction work items. 19 ‘Table 3- 8: Technical parameters of Irrigation channels system 21 ‘Table 3- 9: Statistic of damages caused by rainfall and flood at Ha Tin city, Thách Ha and Cam Xuyen district occurred from 14 October to 19, October, 2010 .24 Table 4- 1 Database used for research 36 ‘Table 5 - 1; Result of frequency analysis of maximum daily rainfall 44 ‘Table 5 - 2: Value of design rainfall distribution of Ha Tinh, Ky Anh and Huong Khe stations during 1 day corresponding to difference frequency (daily rainfall) 44 Table 5 - 3: Sub-catchment of Rao Cai river basin and weighting factors of meteorological station 46 ‘Table 5 - 4: Parameters of UHM in MIKE RR model of Ke Go catchment. AT ‘Table 5 - 5: Different in peaks of observed and simulated discharge for calibration mode at Ke Go reservoir 48 ‘Table 5 - 6: Different in peaks of observed and simulated discharge in verification at Ke Go reservoir 48 ‘Table 5 < 7: Parameters of UHM - SCS for Rao Cai's sub-catchments 50 ‘Table $ - 8. Runoff link ofsub-catchments into river network in MIKE 11 model.S3 ‘Table5 -9: Monitoring points for the calibrating and verifying hydraulic model Table 5 - 10: Results of flood simulation form 2" Oct to 6" Oct, 2010 for calibration of MIKE 11 HD model 35 ‘Table 5 - 11: Results of flood simulation from 12 Oct to 18 Oct- 2010 57 ‘Table 5 - 12: Maximum water level corresponding to design and checking flood of Ke Go reservoir 37 ‘Table 5 - 13.
Designed flooding hazard level scale for the downstream of the Ke Go reservoir. 38 ‘Table 5 - 14, Flood hazard areas for flood event in 2010. Flood hazard areas corresponding to design and checking flood. Criteria of vulnerability map derived from population density for the downstream of the Ke GO reServOIr.
Criteria of vulnerability map derived from population density for the downstream of the Ke Go T€S€TVOIT. s1 nh ng ngà 65 Table 5 - 18. Flood risk map for the downstream area of Ke Go catchment in flood 1n October, 2 ÍŨ. Statistic table of flood risk of different floods.- -- 5-5555: 68 LIST OF FIGURES Figure 3- 1: Map of study aT€a.- --- c1 HH TH HH kg rh 10 Figure 3- 2: Topography of Rao Cai river basin in ASTER global DEM.
11 Figure 3- 3: Hydro-meteorological station network of Rao Cai river basin. 13 Figure 3- 4: The average of monthly rainfall at Ha Tinh station from 1975 - 2010.14 Figure 3- 5: Monthly discharge flow into Ke Go reservoir .:ccessceeseeeteeeeeeeeeees 16 Figure 3- 6: The spillway of Ke Go Reservoir, there are two arc gates. 19 Figure 3- 7: The Emergency spillway of Ke Go TeS€TVOIT.- -- +55 << £++sc+sx2 19 Figure 3- 8: Flood at Ha Tinh city in October, 2010 0. cee eeeseesseeeteeeseeeseeeeeeeees 23 Figure 3- 9: Percentage of damages in terms of money for various categories occurred from 14" to 19", October, 20 ÍŨ.- - - Hs 25 Figure 3- 10: Flood at Ha Tinh city in October, 2012 .- ---sscs<ssersereereee 26 Figure 3- 11: Inundation in the downstream of Ke Go reservoir in June 2TM 2013.27 Figure 3- 12: Flood in Ha Tinh city in October, 2013 .--- 5+5 s*s+<s>+ses++ 27 Figure 4 - 1: Illustration of the research methodOÏOgØ.
-- --««++<«£+se+ssee+s 29 Figure 4 - 2: Mass flow rate in and out of an elementary control volume. 34 Figure 4 - 3: MIKE 11 GIS Input and Output. eee - 5 5S 1+ sskersseeeseeres 35 Figure 4 - 4: Inflow of Ke Go reservoir in October, 2010 .----- «<< s<>++<<++ 37 Figure 4 - 5: Inflow of Ke Go reservoir in October, 2013 .- eee eee eects 37 Figure 4 - 6: Water level at Phu and Hoi Bridge station in October, 2010. 38 Figure 5 - 1: Annual rainfall change on the Rao Cai river basin from 1975 — 2005 41 Figure 5 - 2: Changing of maximum rainfall of Ha Tinh station.-- ---- 42 Figure 5 - 3: Inflow of Ke Go reservoir and actual rainfall 2013 .--- 43 Figure 5 - 4: Rao Cai watershed sub-basin schematizations and Thiessen polygon weighting computation of mean rainfall of sub-catchment in Rao Cai river basin .45 Figure 5 - 5: Parameters of UHM in MIKE RR model of Ke Go catchment .