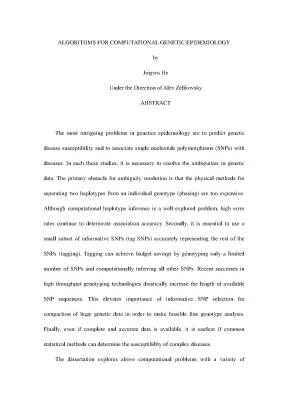
Tổng quan luận án
Luận án tiến sĩ với tiêu đề "Algorithms for Computational Genetic Epidemiology" (Các thuật toán cho dịch tễ học di truyền tính toán) được thực hiện bởi nghiên cứu sinh Jingwu He dưới sự hướng dẫn của Giáo sư Alex Zelikovsky tại Khoa Nghệ thuật và Khoa học (College of Arts and Sciences), Đại học Bang Georgia (Georgia State University), Hoa Kỳ, bảo vệ năm 2006 (mã số UMI: 3243235). Luận án thuộc chuyên ngành Khoa học Máy tính ứng dụng trong Tin sinh học và Dịch tễ học di truyền tính toán.
Tính cấp thiết và khoảng trống nghiên cứu
Trong dịch tễ học di truyền, hai nhiệm vụ trung tâm là dự đoán tính nhạy cảm đối với bệnh di truyền và tìm kiếm mối liên kết giữa các đa hình đơn nucleotide (Single Nucleotide Polymorphisms - SNP) với bệnh lý. Khi phân tích các bệnh phức tạp chịu sự tương tác của nhiều gen, việc sử dụng dữ liệu kiểu đơn bội (haplotype) có ý nghĩa quyết định vì chúng phản ánh tập hợp các alen gen được di truyền cùng nhau trên một nhiễm sắc thể. Tuy nhiên, việc xác định thực nghiệm hai bản sao haplotype từ một kiểu gen (genotype) của sinh vật lưỡng bội bằng phương pháp sinh học phân tử đòi hỏi chi phí kỹ thuật rất cao. Do đó, bài toán suy luận haplotype bằng công cụ tính toán (phasing problem) đóng vai trò then chốt. Mặc dù đã có nhiều công cụ suy luận haplotype, các phương pháp hiện hành vẫn gặp phải hạn chế lớn về thời gian xử lý khi số lượng vị trí SNP lên đến hàng nghìn, và tỷ lệ lỗi cao trong suy luận vẫn làm suy giảm độ chính xác của các phân tích liên kết bệnh.
Bên cạnh đó, các công nghệ giải trình tự thông lượng cao (như các mảng vi điện tử lập bản đồ Affymetrix) tạo ra các chuỗi dữ liệu chứa hàng trăm nghìn SNP (lên tới 250.000 SNP trên các mảng lập bản đồ và khoảng 10 triệu SNP tồn tại trong quần thể người). Khối lượng dữ liệu khổng lồ này đòi hỏi phải nén và chọn lọc một tập hợp con nhỏ các SNP mang tính thông tin cao (tag SNPs) có khả năng đại diện chính xác cho các SNP còn lại (tagging). Việc này vừa giúp tiết kiệm ngân sách thông qua việc chỉ cần định kiểu gen một số lượng giới hạn các SNP rồi suy luận tính toán các SNP còn lại, vừa giúp nén dữ liệu để phục vụ phân tích kiểu gen chi tiết. Cuối cùng, ngay cả khi có dữ liệu đầy đủ và chính xác, các phương pháp phân tích thống kê truyền thống vẫn bộc lộ hạn chế khi áp dụng cho các bệnh phức tạp. Thống kê truyền thống thường dựa trên giả định bệnh do một gen đơn lẻ theo quy luật Mendel gây ra. Ngược lại, nhiều bệnh phức tạp (như rối loạn tâm thần, bệnh Crohn, bệnh tự miễn) có đóng góp di truyền phi Mendel, đa yếu tố, với nhiều gen nhạy cảm tương tác qua lại và có liên kết với nhau, khiến mức tăng xác suất tuyệt đối thường rất nhỏ (ví dụ từ 10/triệu lên 20/triệu) hoặc không phản ánh được tác động tích lũy giữa các vị trí SNP liên kết.
Mục tiêu và các bài toán nghiên cứu
Luận án tập trung xây dựng các thuật toán tính toán có khả năng mở rộng quy mô lớn dựa trên đại số tuyến tính, lý thuyết đồ thị, quy hoạch tuyến tính nguyên và các phương pháp tối ưu hóa tổ hợp tham lam để giải quyết ba nhóm bài toán:
- Bài toán suy luận haplotype quần thể (Population Haplotype Inference Problem) và Bài toán suy luận haplotype cho bộ ba gia đình (Trio Phasing Problem - TPP / Parental Trio Phasing Problem - PTPP): Tăng tốc các công cụ suy luận haplotype phổ biến mà không làm suy giảm chất lượng nghiệm; giải quyết triệt để tính không khả thi và tỷ lệ không nhất quán trong dữ liệu gia đình gồm cha, mẹ và con.
- Bài toán lựa chọn SNP thông tin và dự đoán SNP (Informative Tag SNP Selection and SNP Prediction Problems): Phát triển các thuật toán lựa chọn tag SNP dựa trên đại số tuyến tính, hồi quy tuyến tính bội (Multiple Linear Regression - MLR) và máy vector hỗ trợ (Support Vector Machine - SVM) nhằm tối thiểu hóa số lượng tag SNP cần định kiểu gen nhưng vẫn đạt độ chính xác khôi phục cao; áp dụng tìm kiếm tổ hợp đa SNP liên kết với bệnh tật.
- Bài toán dự đoán tính nhạy cảm với bệnh (Disease Susceptibility Prediction Problem): Đề xuất các thuật toán tổ hợp và đồ thị nhằm phát hiện tổ hợp gen gây bệnh và dự đoán chính xác nguy cơ mắc bệnh phức tạp từ các tập dữ liệu ca bệnh/đối chứng (case/control).
Đối tượng và phạm vi nghiên cứu
- Đối tượng nghiên cứu: Các cấu trúc dữ liệu di truyền gồm SNP hai alen (bi-allelic với các trạng thái 0, 1), kiểu gen (genotype gồm các giá trị 0, 1, 2) và kiểu đơn bội (haplotype gồm các giá trị 0, 1) ở người; các quan hệ phả hệ bộ ba gia đình (trios: cha, mẹ, con); các tổ hợp đa SNP liên kết bệnh.
- Phạm vi không gian và dữ liệu: Dữ liệu mô phỏng theo mô hình tiến hóa kết tụ (coalescent model) được tạo bằng chương trình
ms của Hudson (2002); các tập dữ liệu sinh học thực nghiệm bao gồm dữ liệu haplotype của ruồi giấm (Drosophila), dữ liệu 10 vùng ENCODE thuộc dự án bản đồ đơn bội quốc tế HapMap trên hai quần thể người Hán ở Bắc Kinh (HCB) và người Nhật ở Tokyo (JPT), dữ liệu vùng gen LPL (Nickerson et al.), dữ liệu Nhiễm sắc thể 21 (Patil et al.), dữ liệu vùng 5q31 gồm 103 SNP của 129 bộ ba gia đình mắc bệnh Crohn (Daly et al., 2001), và dữ liệu 1036 cá thể ca bệnh/đối chứng mắc bệnh tự miễn (Ueda et al., 2003).
- Phạm vi thời gian: Luận án được hoàn thành và nghiệm thu vào tháng 12 năm 2006.
Tổng quan tài liệu và vị trí của luận án
Các hướng nghiên cứu trước được luận án điểm lại
Luận án đã hệ thống hóa các công trình nghiên cứu đi trước theo từng nhóm bài toán chuyên biệt:
- Về suy luận haplotype quần thể: Clark (1990) đề xuất thuật toán tổ hợp quy tắc tối giản thực thi trong chương trình HAPINFERX, bắt đầu từ các cá thể đồng hợp tử để giải mã dần các cá thể dị hợp tử; phương pháp này phụ thuộc chặt chẽ vào thứ tự nhập dữ liệu và không thể bắt đầu nếu thiếu cá thể đồng hợp tử tuyệt đối. Stephens et al. (2001) phát triển phần mềm thống kê Bayes PHASE dựa trên lý thuyết kết tụ và di truyền quần thể, có độ chính xác cao nhưng thời gian chạy tăng vọt trên các tập dữ liệu lớn. Niu et al. (2002) giới thiệu thuật toán HAPLOTYPER sử dụng bộ lấy mẫu Gibbs trên các phân đoạn haplotype nhỏ, bị giới hạn ở quy mô dưới 100 SNP và 500 cá thể. Brinza et al. (2005) đề xuất thuật toán 2SNP dựa trên cây khung cực đại với độ phức tạp $O(nm(n+m))$, đạt tốc độ cao hơn các thuật toán kỳ vọng cực đại (EM). Về xây dựng phát sinh chủng loài hoàn hảo (perfect phylogeny), các phương pháp DPPH (Bafna et al., 2003), GPPH (Gusfield, 2002) và HPPH (Eskin et al., 2003) được so sánh; trong đó DPPH đạt tốc độ tốt nhất nhưng vẫn cần cải thiện khả năng mở rộng.
- Về suy luận haplotype trên bộ ba gia đình (Family Trios): Acherman et al. phân tích logic các vị trí SNP của cha mẹ rồi loại bỏ kiểu gen của con trước khi đưa vào phần mềm PHASE, dẫn đến vi phạm ràng buộc cha mẹ - con cái và tạo ra tỷ lệ lỗi 8,02% trên dữ liệu của Daly et al. (2001). Li et al. (2003) xây dựng các thuật toán chính xác và thuật toán heuristic mở rộng khối (block-extension) giải bài toán cấu hình haplotype tái tổ hợp cực tiểu (Minimum-Recombinant Haplotype Configuration - MRHC). Halperin et al. (2003) sử dụng thuật toán tham lam khôi phục dữ liệu thiếu trên các khối haplotype; tuy nhiên, thực nghiệm độc lập của luận án cho thấy phương pháp này tạo ra tỷ lệ không nhất quán lên tới ít nhất 25% trên 16% vị trí nhập nhằng ban đầu của dữ liệu Daly et al.
- Về lựa chọn tag SNP: Carlson et al. (2004) phát triển công cụ IdSelect dựa trên hệ số liên kết mất cân bằng ($r^2$). Halperin et al. (2005) xây dựng công cụ STAMPA dựa trên quy hoạch động để dự đoán kiểu gen. Halldorsson et al. (2004) và Zhang et al. (2004) nghiên cứu tối ưu hóa số lượng thẻ cho haplotype nhưng phương pháp lựa chọn chưa phản ánh trực tiếp cơ chế dự đoán.
- Về nghiên cứu liên kết và dự đoán bệnh phức tạp: Các nghiên cứu liên kết toàn hệ gen (Klein et al., 2005; Herbert et al., 2006) bắt đầu xác định các biến dị đơn. Tuy nhiên, các hạn chế phương pháp luận của phân tích thống kê trực tiếp đối với các bệnh không theo quy luật Mendel đã được chỉ ra bởi Cardon & Bell (2001), Terwilliger & Weiss (2003), Badner & Gershon (2002), và Risch (2000).
Khoảng trống luận án lựa chọn giải quyết
- Các công cụ suy luận haplotype chính xác như PHASE, HAPLOTYPER và DPPH không có khả năng mở rộng khi số lượng SNP đạt hàng nghìn; luận án giải quyết vấn đề này bằng một cơ chế giảm chiều đại số tuyến tính mà không can thiệp sâu vào thuật toán gốc của các công cụ.
- Các phương pháp xử lý dữ liệu bộ ba gia đình hiện có thường tạo ra nghiệm không khả thi (infeasible) hoặc có tỷ lệ không nhất quán logic cao giữa cha mẹ và con cái; luận án lấp đầy khoảng trống này bằng mô hình quy hoạch tuyến tính nguyên và thuật toán tham lam duy trì nghiêm ngặt các ràng buộc phả hệ.
- Việc lựa chọn tag SNP trước đây thường tách rời khỏi phương pháp dự đoán SNP không gắn thẻ; luận án tích hợp trực tiếp việc chọn thẻ với các mô hình dự đoán (đại số tuyến tính, hồi quy tuyến tính bội MLR, máy vector hỗ trợ SVM) để giảm thiểu tối đa số lượng thẻ cần dùng.
- Thiếu hụt các thuật toán tổ hợp có khả năng phát hiện các tổ hợp đa SNP (multi-SNP combinations) có ý nghĩa thống kê sau khi điều chỉnh kiểm định bội và các thuật toán dự đoán nguy cơ mắc bệnh không phụ thuộc vào mô hình đơn gen.
Cơ sở lý thuyết và phương pháp nghiên cứu
Lý thuyết, khái niệm và khung phân tích
-
Biểu diễn dữ liệu bằng đại số tuyến tính:
Luận án thay đổi hệ thống ký hiệu quy ước chuẩn. Thay vì dùng 0 và 1 cho haplotype, tác giả chuyển sang hệ $(-1, 1)$. Với kiểu gen, thay vì quy ước dị hợp tử là 2 và đồng hợp tử là 0 hoặc 1, tác giả chuyển sang hệ $(-1, 1, 0)$, trong đó trạng thái dị hợp tử nhận giá trị 0. Quy ước này dẫn đến tính chất quan trọng:
- Hai vị trí SNP đồng nghĩa (synonymous) hoặc bù nhau sẽ trở nên cộng tuyến (collinear).
- Một vector kiểu gen $g$ tạo từ hai vector haplotype $h$ và $h'$ thỏa mãn hệ thức tuyến tính chính xác: $g = (h + h') / 2$.
- Mối quan hệ giữa ma trận kiểu gen $G$ kích thước $n \times m$ và ma trận các haplotype phân biệt $H'$ kích thước $h \times m$ được mô hình hóa qua tích ma trận:
$$G = I_X \times H'$$
trong đó $I_X$ là ma trận liên thuộc kích thước $n \times h$ của đồ thị kiểu gen - kiểu đơn bội $X = (H, G)$.
- Định lý về hạng tuyến tính của ma trận haplotype: Nếu tập hợp $H$ gồm các haplotype được sinh ra từ $l$ haplotype ban đầu qua các biến cố tái tổ hợp tại $g$ điểm nóng (hotspots), hạng tuyến tính của $H$ bị chặn trên bởi:
$$\text{rank}(H) \le (g + 1)(l - 1) + 1$$
Khi khởi đầu từ 2 haplotype ($l=2$), hạng tuyến tính $\text{rank}(H) \le g + 2$.
-
Lý thuyết đồ thị và tính khả giải duy nhất:
Đồ thị $X = (H, G)$ có các đỉnh là haplotype và các cạnh là kiểu gen. Luận án chứng minh rằng đồ thị $X$ là không tầm thường (nontrivial - tức ma trận liên thuộc $I_X$ có hạng cột đầy đủ) khi và chỉ khi mọi thành phần liên thông của nó không phải là đồ thị phân đôi (not bipartite). Nếu tồn tại thành phần liên thông phân đôi, nghiệm haplotype sẽ không duy nhất.
-
Các khung thuật toán tối ưu hóa:
- Quy hoạch tuyến tính nguyên (Integer Linear Programming - ILP) cho bài toán Trio Phasing.
- Hồi quy tuyến tính bội (Multiple Linear Regression - MLR) trong hệ mã hóa giới hạn sigma (sigma-restricted coding).
- Bộ phân loại máy vector hỗ trợ (Support Vector Machine - SVM).
- Thuật toán tham lam giải bài toán phủ tập hợp (Set Covering Greedy Algorithm) để sàng lọc SNP và dự đoán kiểu hình bệnh.
Phương pháp thực tế
- Thuật toán giảm chiều tuyến tính (Linear Reduction):
- Giai đoạn mã hóa (Encoding): Áp dụng phép khử Gauss-Jordan với độ phức tạp $O(n^2 m)$ trên ma trận kiểu gen $G$ để xác định $r = \text{rank}(G)$ cột độc lập tuyến tính, phân tách $G = G_r \times (E_r \mid C')$.
- Giai đoạn suy luận: Áp dụng công cụ suy luận haplotype bất kỳ (DPPH, PHASE, HAPLOTYPER) trên ma trận kiểu gen đã thu gọn $G_r$ kích thước $n \times r$.
- Giai đoạn giải mã (Decoding Algorithm): Dựng đồ thị haplotype thu gọn $X_r$. Lan truyền nhãn dọc theo các cạnh bằng thuật toán tìm kiếm theo chiều rộng (Breadth-First Search - BFS) trên từng thành phần liên thông để khôi phục toàn bộ $m$ vị trí SNP của ma trận haplotype $H'$, tránh được các phép nhân ma trận sinh ra phần tử không hợp lệ.
- Phương pháp Trio Phasing: Phân tích logic loại trừ các trường hợp không nhập nhằng (chỉ xảy ra nhập nhằng khi cả cha, mẹ và con đều có kiểu gen dị hợp tử '2' tại cùng một SNP); thiết lập các biến nguyên biểu diễn các pha dị hợp và giải bằng quy hoạch tuyến tính nguyên hoặc thuật toán tham lam.
- Phương pháp lựa chọn Tag SNP:
- Thuật toán chọn thẻ từng bước (Stepwise tag selection): Lần lượt bổ sung SNP làm tăng độ chính xác dự đoán tổng thể nhiều nhất.
- Thuật toán cực tiểu hóa cục bộ (Local-minimization tag selection): Tối ưu hóa tập thẻ qua việc thay thế từng phần tử.
- Phương pháp đánh giá và kiểm định:
- Kiểm định chéo loại một (leave-one-out cross-validation).
- Đánh giá chất lượng dự đoán qua hệ số xác định ($R^2$ trung bình và cực tiểu) và tỷ lệ dự đoán chính xác (prediction accuracy).
- Kiểm định tái lấy mẫu Bootstrapping với độ tin cậy 95% (lấy giá trị xấu thứ 5 trong 100 lần lặp).
- Kiểm định ngẫu nhiên hóa Monte-Carlo bằng cách tráo đổi ngẫu nhiên nhãn ca bệnh/đối chứng để thiết lập mức nền giả thuyết không.
Nguồn tư liệu và dữ liệu thực nghiệm
- Dữ liệu mô phỏng: Sinh từ chương trình
ms với các tỷ lệ tái tổ hợp $R \in {0, 4, 16, 40}$, quy mô từ 20 đến 100 cá thể và chiều dài từ 30 đến 25.000 SNP.
- Dữ liệu sinh học thực tế:
- 25 tập dữ liệu kiểu gen ruồi giấm Drosophila.
- Dữ liệu 129 bộ ba gia đình vùng 5q31 gồm 103 SNP liên quan đến bệnh Crohn (Daly et al., 2001).
- Dữ liệu Gabriel et al. (2002) về các khối liên kết mất cân bằng trên hệ gen người.
- Dữ liệu 10 vùng ENCODE HapMap trên quần thể HCB và JPT.
- Dữ liệu locus LPL (Nickerson et al.) và Nhiễm sắc thể 21 (Patil et al.).
- Dữ liệu 1036 cá thể nghiên cứu bệnh tự miễn (Ueda et al., 2003).
Nội dung chính theo từng chương
Chapter 1: Introduction
Chương này giới thiệu tổng quan bối cảnh khoa học của dịch tễ học di truyền tính toán, nêu rõ thách thức của việc xử lý các tập dữ liệu SNP quy mô lớn từ các mảng lập bản đồ mật độ cao. Tác giả phân tích cấu trúc của bộ gen lưỡng bội, sự khác biệt giữa kiểu gen và kiểu đơn bội, và định nghĩa SNP như một vị trí biến dị nucleotide có tần số ít nhất 1% trong quần thể. Tác giả trình bày sơ đồ lộ trình luận án và tóm tắt bốn đóng góp nghiên cứu chính: tăng tốc các công cụ phasing bằng đại số tuyến tính, giải bài toán phasing bộ ba gia đình, phát triển các phương pháp chọn tag SNP tiên tiến (MLR, SVM), và xây dựng các thuật toán tổ hợp dự đoán tính nhạy cảm đối với bệnh phức tạp.
Chapter 2: Biology Background: SNPs, Haplotypes, Genotypes, and Notations
Chương 2 cung cấp hệ thống kiến thức sinh học phân tử nền tảng làm cơ sở cho các mô hình toán học trong luận án:
- Bốn cấp độ tổ chức vật chất di truyền: Bộ gen (Genome), Nhiễm sắc thể (Chromosomes), Gen (Genes) và ADN (DNA). Cấu trúc chuỗi xoắn kép ADN tuân theo nguyên tắc bổ sung A-T và G-C.
- Bộ gen người gồm 46 nhiễm sắc thể (23 cặp), bao gồm 22 cặp nhiễm sắc thể thường giống nhau ở hai giới và 1 cặp nhiễm sắc thể giới tính (XX ở nữ và XY ở nam). Mỗi cá thể nhận một bản sao từ bố và một bản sao từ mẹ.
- Cơ chế phát sinh biến dị: đột biến (mutation), trao đổi chéo (crossing over) và tái tổ hợp di truyền (genetic recombination) trong giảm phân.
- Định nghĩa toán học của SNP: Các biến dị hai alen (bi-allelic), quy ước alen chính (major allele/wild type) là 0 và alen phụ (minor allele/mutation) là 1. Kiểu gen đồng hợp tử được biểu diễn là 0 hoặc 1, kiểu gen dị hợp tử biểu diễn là 2.
- Giới thiệu các dự án hệ gen lớn cung cấp nguồn dữ liệu mở, bao gồm Dự án Bộ gen Người (Human Genome Project), dự án HapMap và dự án ENCODE.
Chapter 3: Haplotype Inference Problem
Chương 3 tập trung giải quyết bài toán suy luận haplotype từ kiểu gen cho cả hai trường hợp: quần thể không liên quan và bộ ba gia đình.
1. Suy luận haplotype quần thể bằng phương pháp giảm chiều đại số tuyến tính
Tác giả thiết lập hệ ký hiệu $(-1, 1, 0)$ và chứng minh các định lý về chặn trên của hạng ma trận haplotype trong điều kiện tái tổ hợp tập trung tại các điểm nóng. Thuật toán giảm chiều tuyến tính trích xuất $r$ vị trí SNP độc lập tuyến tính, chuyển ma trận kiểu gen về kích thước $n \times r$. Sau khi công cụ phasing độc lập tìm ra ma trận haplotype thu gọn, Thuật toán Giải mã (Decoding Algorithm) dựa trên duyệt BFS trên đồ thị kiểu gen - kiểu đơn bội sẽ khôi phục lại toàn bộ $m$ vị trí ban đầu.
Bảng thực nghiệm so sánh thời gian thực thi giữa công cụ DPPH chuẩn và DPPH kết hợp giảm chiều tuyến tính (Linearly Reduced DPPH) trên dữ liệu mô phỏng từ ms (trung bình qua 100 tập dữ liệu cho mỗi cấu hình, tỷ lệ tái tổ hợp bằng 0):
| Số vị trí SNP ($m$) |
Quy mô mẫu ($n$) |
Thời gian DPPH chuẩn (giây) |
Tổng thời gian LR-DPPH (giây) |
Thời gian mã hóa/giải mã (giây) |
Thời gian chạy DPPH thu gọn (giây) |
Hệ số tăng tốc |
| 30 |
50 |
0,08 |
0,02 |
0,01 |
0,01 |
4,0× |
| 60 |
30 |
0,16 |
0,03 |
0,01 |
0,02 |
5,3× |
| 100 |
50 |
0,92 |
0,08 |
0,03 |
0,05 |
11,5× |
| 200 |
100 |
8,45 |
0,42 |
0,15 |
0,27 |
20,1× |
| 500 |
100 |
112,60 |
1,88 |
0,62 |
1,26 |
59,9× |
Thực nghiệm trên PHASE và HAPLOTYPER cho thấy:
- Với PHASE trên tập dữ liệu 60 SNP và 30 cá thể, thời gian chạy giảm từ 201,4 giây xuống còn một phần nhỏ khi áp dụng giảm chiều, trong khi sai số haplotype (đo bằng tỷ lệ trung bình giữa số haplotype âm tính giả và dương tính giả) sai khác không đáng kể so với nghiệm gốc.
- Trên dữ liệu sinh học thực tế gồm 25 tập dữ liệu Drosophila (43 SNP, 11 cá thể) và vùng 616 kilobase của Daly et al., HAPLOTYPER kết hợp giảm chiều tuyến tính (LRH) cho kết quả đồng nhất với HAPLOTYPER gốc (H) nhưng thời gian chạy giảm rõ rệt.
2. Phasing và khôi phục dữ liệu thiếu trên bộ ba gia đình (Family Trios)
Tác giả hình thức hóa bài toán Trio Phasing Problem (TPP) và bài toán con Parental Trio Phasing Problem (PTPP). Phân tích logic chứng minh sự nhập nhằng chỉ xuất hiện khi cả ba cá thể (cha, mẹ, con) đều dị hợp tử (giá trị 2) tại cùng một vị trí SNP. Tác giả chỉ ra nhược điểm của các phương pháp trước:
- Acherman et al. loại bỏ kiểu gen của con dẫn đến tỷ lệ lỗi 8,02% trên dữ liệu Daly et al.
- Phương pháp tham lam của Halperin et al. (2003) có tỷ lệ lỗi 2,8% trên 10% dữ liệu bị xóa giả lập, nhưng trên 16% vị trí nhập nhằng ban đầu lại tạo ra tỷ lệ không nhất quán lên tới ít nhất 25%.
- Luận án đề xuất mô hình Quy hoạch tuyến tính nguyên (ILP) và thuật toán tham lam mới, loại bỏ hoàn toàn các nghiệm không khả thi và duy trì tính nhất quán phả hệ 100%.
Chapter 4: Informative SNP Selection
Chương 4 nghiên cứu bài toán lựa chọn tập hợp con tag SNP và dự đoán các SNP không gắn thẻ.
1. Phương pháp đại số tuyến tính
Dựa trên phép khử Gauss-Jordan và làm tròn các tổ hợp tuyến tính phân số. Trên dữ liệu mô phỏng quy mô lớn (> 25.000 SNP), phương pháp cho thấy khả năng nén vượt trội: chỉ cần sử dụng 0,4% tổng số SNP làm thẻ (được chọn từ 10% mẫu quần thể), thuật toán có thể tái tạo toàn bộ haplotype chưa biết với độ chính xác đạt 98% (tỷ lệ lỗi 2%).
2. Phương pháp hồi quy tuyến tính bội (MLR)
Tác giả đề xuất mô hình dự đoán SNP bằng MLR sử dụng mã hóa giới hạn sigma. Khi dự đoán một SNP không gắn thẻ, MLR tích hợp thông tin từ toàn bộ các tag SNP đã chọn. Tác giả kết hợp MLR với hai chiến lược chọn thẻ: thuật toán từng bước (stepwise - tốc độ nhanh) và thuật toán cực tiểu hóa cục bộ (local-minimization - tốc độ chậm hơn nhưng tối ưu hơn).
Thực nghiệm trên 10 vùng ENCODE HapMap cho thấy MLR kết hợp chọn thẻ từng bước chỉ cần sử dụng số lượng tag SNP bằng một nửa so với STAMPA (Halperin et al., 2005) và phương pháp của Halldorsson et al. (2004) để đạt độ chính xác dự đoán 90%:
| Phương pháp |
Vùng ENr123 (HCB) |
Vùng ENr123 (JPT) |
Vùng ENm010 (HCB) |
Vùng ENm010 (JPT) |
| MLR-tagging (đạt 90% chính xác) |
12 thẻ |
14 thẻ |
18 thẻ |
19 thẻ |
| STAMPA (đạt 90% chính xác) |
25 thẻ |
28 thẻ |
35 thẻ |
37 thẻ |
| IdSelect ($r^2 \ge 0,8$) |
42 thẻ |
45 thẻ |
58 thẻ |
61 thẻ |
3. Phương pháp máy vector hỗ trợ (SVM)
Tác giả mô hình hóa bài toán dự đoán SNP nhị phân như một bài toán phân loại hai lớp bằng SVM. Kết hợp SVM với thuật toán chọn thẻ từng bước (SVM/STA) mang lại độ chính xác cao hơn MLR: trên tập dữ liệu gồm 103 SNP của Daly et al. (2001), SVM/STA chỉ cần đúng 3 tag SNP để đạt độ chính xác dự đoán 90% cho toàn bộ các SNP còn lại trong kiểm định leave-one-out. Tuy nhiên, thời gian tính toán của SVM lớn hơn đáng kể so với MLR.
4. Ứng dụng lựa chọn tag SNP trong tìm kiếm liên kết bệnh
Tác giả sử dụng kỹ thuật nén MLR kết hợp giải thuật tìm kiếm tổ hợp để quét các tổ hợp đa SNP (multi-SNP combinations) liên kết với bệnh:
- Trên dữ liệu bệnh Crohn (Daly et al., 2001), không có bất kỳ SNP đơn lẻ hay cặp SNP nào đạt mức ý nghĩa thống kê; tuy nhiên, phương pháp tổ hợp của tác giả đã phát hiện các tổ hợp đa SNP chưa phân pha (unphased) có giá trị p-value hiệu chỉnh sau kiểm định bội đạt dưới 0,05 ($p < 0,05$).
- Trên dữ liệu bệnh tự miễn (Ueda et al., 2003), phương pháp phát hiện thêm nhiều tổ hợp đa SNP cả ở dạng unphased và phased có liên kết chặt chẽ với bệnh.
Chapter 5: Disease Susceptibility Prediction
Chương 5 xây dựng các phương pháp tổ hợp dự đoán tính nhạy cảm bệnh lý từ dữ liệu ca bệnh/đối chứng.
1. Thuật toán tham lam phủ tập hợp (Set Covering Greedy Algorithm)
Thuật toán quy đổi bài toán loại bỏ các SNP dư thừa không liên quan nhưng vẫn giữ nguyên vẹn thông tin phân biệt kiểu hình bệnh về bài toán phủ tập hợp kinh điển. Các SNP có khả năng phân tách tốt nhất giữa nhóm ca bệnh và nhóm đối chứng được ưu tiên giữ lại.
2. Các thuật toán dự đoán kiểu hình
Tác giả xây dựng hai thuật toán dự đoán chính:
- Second Neighbor (Láng giềng bậc hai): Phân loại cá thể dựa trên cấu trúc liên kết đồ thị giữa các haplotype tương đồng.
- Haplotype Weighting (Gán trọng số Haplotype): Tính toán trọng số phân bố của từng cấu hình haplotype xuất hiện trong nhóm bệnh so với nhóm chứng.
Kết quả thực nghiệm trên hai tập dữ liệu thực:
- Tập dữ liệu bệnh Crohn (Daly et al., 129 bộ ba): Phương pháp đạt tỷ lệ dự đoán chính xác ban đầu là 77,x%. Sau khi thực hiện kiểm định tái lấy mẫu Bootstrapping (100 lần lặp chọn ngẫu nhiên 20 ca bệnh và 200 đối chứng), tỷ lệ dự đoán chính xác với độ tin cậy 95% đạt 75,38%.
- Kiểm định hoán vị Monte-Carlo: Khi tiến hành tráo đổi ngẫu nhiên nhãn ca bệnh/đối chứng trên dữ liệu bệnh Crohn, tỷ lệ dự đoán chính xác của tất cả các thuật toán lập tức sụt giảm về mức 50% (tương đương đoán ngẫu nhiên). Kết quả này khẳng định locus nghiên cứu có mối liên kết di truyền thực sự với bệnh Crohn và thuật toán không bị hiện tượng khớp quá mức (overfitting).
Chapter 6: Conclusion and Future Work
Chương cuối tóm tắt lại các kết quả đã đạt được trong luận án và vạch ra ba hướng nghiên cứu mở rộng:
- Xây dựng các ước lượng không chệch (unbiased estimates) cho kỹ thuật lựa chọn tag SNP bằng MLR.
- Ứng dụng các thuật toán phân loại và tối ưu hóa tổ hợp vào bài toán dự đoán vị trí liên kết cơ chất của protein (protein substrate prediction), tích hợp với phần mềm mô hình hóa phân tử AMMP.
- Ứng dụng các mô hình thuật toán vào mô phỏng động học hành vi của tế bào vi khuẩn trong các điều kiện sinh trưởng cụ thể theo thời gian (từ $t = 0$ đến $t = 999$).
Kết quả và những đóng góp mới
Đóng góp về mặt lý luận
- Thiết lập hệ thống ký hiệu đại số $(-1, 1)$ cho haplotype và $(-1, 1, 0)$ cho kiểu gen, cho phép áp dụng trực tiếp các công cụ đại số tuyến tính vào di truyền học phân tử.
- Chứng minh định lý về chặn trên của hạng ma trận haplotype dưới tác động của các biến cố tái tổ hợp tại các điểm nóng: $\text{rank}(H) \le (g+1)(l-1)+1$.
- Thiết lập điều kiện cần và đủ về cấu trúc đồ thị không phân đôi để đảm bảo nghiệm giải mã duy nhất của bài toán suy luận haplotype qua ma trận liên thuộc.
- Xây dựng khung toán học tích hợp giữa phương pháp lựa chọn tag SNP với các thuật toán học máy dự đoán (MLR và SVM), chứng minh rằng giá trị của một tập tag SNP luôn gắn liền với phương pháp dự đoán được lựa chọn.
- Đề xuất khung phân tích tổ hợp đa SNP nhằm vượt qua các giới hạn của mô hình phân tích thống kê đơn gen truyền thống đối với các bệnh di truyền phức tạp.
Đóng góp về mặt thực tiễn và giải pháp kỹ thuật
- Tăng tốc công cụ suy luận haplotype: Giảm thời gian chạy của công cụ phát sinh chủng loài DPPH tới 60 lần trên dữ liệu lớn mà không làm thay đổi nghiệm; giảm mạnh thời gian tính toán của PHASE và HAPLOTYPER mà không làm suy giảm chất lượng suy luận.
- Khắc phục lỗi phasing trên bộ ba gia đình: Xây dựng mô hình ILP và thuật toán tham lam giải quyết triệt để vấn đề nghiệm không khả thi và vi phạm ràng buộc cha mẹ - con cái vốn tồn tại trong các công cụ trước đây (loại bỏ hoàn toàn mức lỗi 8,02% của Acherman et al. và tính không nhất quán $\ge 25%$ của Halperin et al.).
- Tối ưu hóa chi phí định kiểu gen: Phần mềm MLR-tagging và SVM-tagging cho phép giảm tới 50% số lượng tag SNP cần định kiểu gen so với các công cụ STAMPA và IdSelect để đạt cùng mức độ chính xác 90%. Đặc biệt, SVM/STA chỉ cần 3 tag SNP để dự đoán 103 SNP trên vùng 5q31.
- Phát hiện dấu ấn bệnh học: Xác định các tổ hợp đa SNP có ý nghĩa liên kết thống kê hiệu chỉnh ($p < 0,05$) đối với bệnh Crohn trên dữ liệu Daly et al. và bệnh tự miễn trên dữ liệu Ueda et al., trong khi các phân tích đơn SNP thất bại.
- Dự đoán nhạy cảm bệnh: Đạt độ chính xác dự đoán 75,38% (độ tin cậy 95%) cho bệnh Crohn trên dữ liệu thực tế.
Hạn chế và hướng nghiên cứu tiếp
Hạn chế được văn bản đề cập
- Khả năng không đẳng cấu của đồ thị giải mã: Về mặt lý thuyết, nếu đồ thị rút gọn $X_r$ và đồ thị đầy đủ $X_m$ không đẳng cấu, thuật toán giải mã đại số tuyến tính bắt buộc phải thực hiện thao tác tách đỉnh (splitting vertices). Mặc dù hiện tượng này không xảy ra trong bất kỳ tập thực nghiệm nào của luận án, đây vẫn là một trường hợp ngoại lệ cần xử lý trong chứng minh giải thuật tổng quát.
- Chi phí tính toán của SVM: Phương pháp SVM-tagging đạt độ chính xác khôi phục SNP cao hơn MLR nhưng đòi hỏi thời gian tính toán lớn hơn đáng kể, làm hạn chế khả năng áp dụng trên các chuỗi SNP có độ dài cực lớn.
- Giả định về điểm nóng tái tổ hợp: Các chặn trên về hạng ma trận haplotype dựa trên giả định các biến cố tái tổ hợp tập trung tại một số lượng giới hạn các điểm nóng nằm giữa các SNP liên tiếp.
- Phạm vi dữ liệu thực tế: Các thực nghiệm dự đoán bệnh mới chỉ được kiểm chứng trên hai bộ dữ liệu bệnh lý cụ thể là bệnh Crohn (129 bộ ba gia đình) và bệnh tự miễn (1036 cá thể).
Hướng nghiên cứu tiếp
- Nghiên cứu các phương pháp ước lượng không chệch cho thuật toán MLR Tagging nhằm hoàn thiện độ chuẩn xác thống kê.
- Mở rộng thuật toán dự đoán cấu trúc sang lĩnh vực hóa tin học để dự đoán các vị trí liên kết cơ chất trên phân tử protein bằng phần mềm AMMP.
- Xây dựng mô hình mô phỏng hành vi sinh học của tế bào vi khuẩn dưới các điều kiện môi trường và sinh trưởng xác định theo trục thời gian (kiểm chứng từ bước thời gian $t=0$ đến $t=999$).
Giá trị tham khảo
Luận án là tài liệu tham khảo hữu ích cho nhiều nhóm đối tượng nghiên cứu:
- Nghiên cứu sinh và nhà nghiên cứu Khoa học Máy tính / Tin sinh học: Cung cấp phương pháp luận giảm chiều dữ liệu bằng đại số tuyến tính kết hợp đồ thị để tăng tốc các thuật toán NP-khó trong xử lý chuỗi di truyền; kỹ thuật mô hình hóa quy hoạch tuyến tính nguyên cho dữ liệu phả hệ bộ ba gia đình (Chương 3).
- Các nhà dịch tễ học di truyền và di truyền học thống kê: Cung cấp giải pháp lựa chọn tag SNP thông qua phần mềm MLR-tagging và SVM-tagging giúp tiết kiệm kinh phí thí nghiệm giải trình tự; cung cấp phương pháp luận tìm kiếm tổ hợp đa SNP liên kết bệnh phức tạp mà các công cụ đơn vị trí (single-locus GWAS) bỏ sót (Chương 4).
- Các nhà phát triển phần mềm tin sinh học: Cung cấp mã nguồn thuật toán và nguyên lý thiết kế bộ tiền xử lý (pre-processor) và hậu xử lý (post-processor) để tích hợp vào các phần mềm phasing tiêu chuẩn như PHASE, HAPLOTYPER hay DPPH mà không cần viết lại mã nguồn cốt lõi của các phần mềm này.
Câu hỏi thường gặp
1. Kỹ thuật giảm chiều đại số tuyến tính của luận án giúp tăng tốc các phần mềm phasing như thế nào?
Thuật toán chuyển đổi ma trận kiểu gen $n \times m$ sang hệ $(-1, 1, 0)$ rồi dùng phép khử Gauss-Jordan $O(n^2 m)$ để loại bỏ các cột phụ thuộc tuyến tính, chỉ giữ lại $r = \text{rank}(G)$ cột độc lập. Phần mềm phasing bên ngoài (như DPPH, PHASE, HAPLOTYPER) chỉ cần giải trên ma trận thu gọn $n \times r$. Sau đó, Thuật toán Giải mã (Decoding Algorithm) dựa trên cấu trúc đồ thị kiểu gen - kiểu đơn bội và thuật toán tìm kiếm theo chiều rộng (BFS) sẽ khôi phục lại toàn bộ $m$ vị trí trong thời gian tuyến tính, giúp tăng tốc DPPH tới 60 lần mà vẫn cho kết quả hoàn toàn đồng nhất.
2. Vì sao phương pháp suy luận haplotype bộ ba gia đình của Acherman et al. lại mắc tỷ lệ sai số 8,02% trên dữ liệu Daly et al.?
Phương pháp của Acherman et al. chỉ sử dụng phân tích logic để suy luận các SNP của cha mẹ, sau đó loại bỏ hoàn toàn kiểu gen của con rồi mới chuyển dữ liệu cha mẹ vào phần mềm PHASE. Do kiểu gen của người con bị loại bỏ, PHASE không còn duy trì được các ràng buộc di truyền phả hệ nghiêm ngặt giữa cha mẹ và con cái, dẫn tới việc tái tạo ra các cặp haplotype không khớp với kiểu gen thực tế của con với tỷ lệ lỗi 8,02%.
3. Phương pháp lựa chọn tag SNP bằng hồi quy tuyến tính bội (MLR) vượt trội hơn STAMPA ở điểm nào?
STAMPA (Halperin et al., 2005) sử dụng quy hoạch động trên từng đoạn rời rạc, trong khi MLR trong mã hóa giới hạn sigma tích lũy thông tin tương quan từ toàn bộ tập hợp tag SNP để dự đoán từng SNP không gắn thẻ. Thực nghiệm trên 10 vùng ENCODE HapMap chứng minh rằng để đạt độ chính xác dự đoán 90% trong kiểm định leave-one-out, MLR kết hợp chọn thẻ từng bước chỉ cần số lượng tag SNP bằng khoảng một nửa so với STAMPA và IdSelect.
4. Bằng chứng thực nghiệm nào khẳng định tính nhạy cảm di truyền đối với bệnh Crohn trong luận án là xác thực chứ không phải do ngẫu nhiên?
Tác giả đã thực hiện hai kiểm định thống kê: thứ nhất, kiểm định tái lấy mẫu Bootstrapping 100 lần lặp độc lập cho thấy độ chính xác dự đoán đạt 75,38% ở khoảng tin cậy 95%; thứ hai, kiểm định hoán vị Monte-Carlo tráo đổi ngẫu nhiên nhãn ca bệnh và đối chứng khiến tỷ lệ dự đoán chính xác của toàn bộ các phương pháp lập tức rơi xuống mức 50% (mức ngẫu nhiên). Điều này chứng minh thuật toán phát hiện đúng tín hiệu di truyền thực chất của locus 5q31.
5. Phương pháp SVM-tagging thể hiện hiệu suất ra sao trên tập dữ liệu 103 SNP của Daly et al.?
Khi áp dụng trên dữ liệu 103 SNP thuộc vùng 5q31 của Daly et al. (2001), phương pháp kết hợp máy vector hỗ trợ với thuật toán chọn thẻ từng bước (SVM/STA) chỉ cần sử dụng đúng 3 tag SNP để đạt độ chính xác dự đoán 90% cho toàn bộ 100 SNP còn lại trong kiểm định leave-one-out, đạt độ nén cao hơn so với cả phương pháp MLR và phương pháp của Halldorsson et al.
Kết luận
Luận án tiến sĩ của Jingwu He đã giải quyết một cách có hệ thống các thách thức tính toán trọng yếu trong dịch tễ học di truyền, bao gồm bài toán suy luận haplotype, lựa chọn tag SNP và dự đoán tính nhạy cảm đối với bệnh phức tạp. Bằng việc kết hợp đại số tuyến tính, lý thuyết đồ thị và các mô hình học máy (MLR, SVM), tác giả đã đề xuất các giải pháp giúp tăng tốc vượt bậc các công cụ phasing kinh điển, tối ưu hóa triệt để số lượng SNP chỉ thị cần định kiểu gen và loại bỏ tính không khả thi trong phân tích dữ liệu bộ ba gia đình. Các kết quả thực nghiệm trên các tập dữ liệu mô phỏng quy mô lớn và dữ liệu sinh học thực tế (HapMap, bệnh Crohn, bệnh tự miễn) khẳng định giá trị ứng dụng thực tiễn cao của các thuật toán trong việc giảm thiểu chi phí giải trình tự và nâng cao độ chính xác của các nghiên cứu liên kết di truyền.