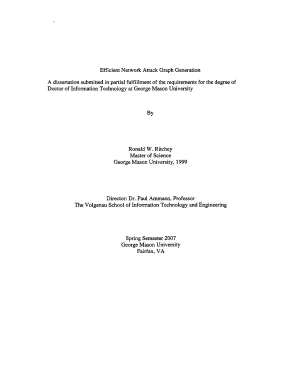
Tổng quan về luận án
Luận án tiến sĩ với tiêu đề "Efficient Network Attack Graph Generation" (Tạo đồ thị tấn công mạng hiệu quả) do tác giả Ronald W. Ritchey thực hiện dưới sự hướng dẫn của GS. Paul Ammann tại Trường Công nghệ Thông tin và Kỹ thuật Volgenau thuộc Đại học George Mason (George Mason University - GMU, 2006/2007). Công trình thuộc chuyên ngành Khoa học Máy tính và Công nghệ Thông tin (Chuyên sâu: An ninh Mạng và Đảm bảo Thông tin). Đây là một trong những nghiên cứu nền tảng đặt nền móng cho lĩnh vực phân tích lỗ hổng bảo mật tự động dựa trên đồ thị tấn công (Automated Attack Graph Analysis) trong các hệ thống mạng doanh nghiệp quy mô lớn.
graph TD
    subgraph Input_Layer ["Dữ liệu Đầu vào"]
        SC[Vulnerability Scanners: Nessus / Foundstone]
        FW[Firewall / Router ACL Rules]
        TP[Network Topology & Switches / Hubs]
    end

    subgraph Modeling_Engine ["Mô hình Hóa Đa tầng TCP/IP"]
        L2[Link Layer: LINK_ARP / LINK_SNIFF]
        L34[Transport Layer: TRANS_SERVICE / TRANS_UNUSED]
        L7[App Layer: APP_PW_AUTH / APP_RHOSTS]
    end

    subgraph Core_Algorithms ["Thuật toán Phân tích & Biến dị"]
        MA[findMaximalAccess Algorithm]
        MUT[Mutation Operators: Add Connectivity / Add Vulnerability]
        TC[Revised Transitive Closure Procedure]
    end

    subgraph Output_Layer ["Kết quả Phân tích Đột phá"]
        AG[Host-Centric Attack Graph]
        RS[Architectural Resiliency Score]
        PR[Prioritized Remediation Matrix]
    end

    Input_Layer --> Modeling_Engine
    Modeling_Engine --> Core_Algorithms
    Core_Algorithms --> Output_Layer
Bối cảnh khoa học và tính tiên phong của nghiên cứu
Vào đầu thập niên 2000, quản trị an ninh mạng chủ yếu dựa vào các công cụ quét lỗ hổng cục bộ (vulnerability scanners) như Nessus, Foundstone và eEye. Mặc dù các công cụ này xác định được hàng nghìn lỗ hổng đơn lẻ trên từng máy chủ (host), chúng hoàn toàn bỏ qua tương tác phức tạp giữa các hệ thống trong mạng và gán mức độ nghiêm trọng (High, Medium, Low) một cách tĩnh, cô lập. Điều này tạo ra tình trạng "báo động giả" và quá tải thông tin, khiến đội ngũ an ninh không thể phân định được lỗ hổng nào thực sự đe dọa đến tài sản trọng yếu. Luận án của Ritchey tiên phong giải quyết bài toán cốt lõi: tự động hóa mô hình hóa đường đi của kẻ tấn công bằng đồ thị tấn công (Attack Graph), xâu chuỗi các lỗ hổng riêng lẻ thành chuỗi khai thác đa bước (multi-step exploit paths) trong môi trường mạng thực tế.
Khoảng trống nghiên cứu (Research Gap) cụ thể
Trước nghiên cứu này, các phương pháp tạo đồ thị tấn công dựa trên kiểm tra mô hình hình thức (Model Checking) như công trình của Ritchey & Ammann (2000), Jha et al. (2002) và Sheyner et al. (2002, 2004) vấp phải vấn đề bùng nổ không gian trạng thái (state-space explosion problem) với độ phức tạp hàm mũ $O(2^n)$. Các mô hình này không thể mở rộng (scale) cho mạng doanh nghiệp vượt quá vài chục nút. Ngược lại, các mô hình đồ thị đơn giản hóa lại trừu tượng hóa quá mức cấu trúc mạng, bỏ qua các đặc tính thiết yếu của giao thức TCP/IP như khả năng bắt gói tin (packet sniffing) ở tầng Liên kết, chuyển tiếp cổng (port forwarding) ở tầng Giao vận, hoặc cơ chế ủy thác cấu hình (trust relationships) ở tầng Ứng dụng.
Câu hỏi nghiên cứu và Giả thuyết khoa học
Luận án thiết lập 3 câu hỏi nghiên cứu (Research Questions - RQ) và 3 giả thuyết tương ứng (Hypotheses - H):
- RQ1: Làm thế nào để tự động hóa việc xây dựng và phân tích đồ thị tấn công nhưng vẫn duy trì độ chân thực (fidelity) của các tầng giao thức mạng TCP/IP thực tế?
- H1: Việc xây dựng và phân tích đồ thị tấn công có thể được tự động hóa hoàn toàn trong khi vẫn phản ánh chính xác các đặc tính kỹ thuật đa tầng của mạng TCP/IP thực.
- RQ2: Làm thế nào để đánh giá định lượng độ kiên cường an ninh (security resiliency) của một kiến trúc mạng trước các lỗ hổng chưa biết (zero-day exploits)?
- H2: Đồ thị tấn công kết hợp kỹ thuật phân tích biến dị (Mutation Analysis) có thể đo lường định lượng độ kiên cường của kiến trúc mạng doanh nghiệp trước các thay đổi cấu hình và khai thác mới.
- RQ3: Làm thế nào để vượt qua rào cản bùng nổ không gian trạng thái nhằm tạo đồ thị tấn công trên mạng quy mô doanh nghiệp trong thời gian gần thực tế (near-real time)?
- H3: Đồ thị tấn công có thể mở rộng quy mô lên hàng nghìn nút mạng doanh nghiệp thông qua mô hình hướng máy chủ (Host-Centric Model) và thuật toán xấp xỉ đơn điệu (Monotonicity) đạt độ phức tạp thời gian đa thức (Polynomial-time complexity).
Khung lý thuyết và Đóng góp định lượng
Luận án tích hợp lý thuyết kiểm tra tính tiếp cận của đồ thị (Graph Reachability Theory), giả định tính đơn điệu (Monotonicity Assumption của Ammann et al., 2002), và lý thuyết kiểm thử biến dị phần mềm (Software Mutation Theory của DeMillo & Offutt, 1995). Đóng góp mang tính cách mạng của luận án là giảm độ phức tạp tính toán từ $O(2^{|E|})$ (NP-complete) xuống thời gian đa thức $O(|V| \cdot |E|)$ hoặc $O(N^3)$, cho phép phân tích mạng chứa hàng nghìn máy chủ chỉ trong vài giây đến vài phút thay vì hàng chục giờ.
Literature Review và Positioning
Luận án tiến hành tổng quan và định vị nghiên cứu dựa trên 5 trường phái học thuật chính trong an ninh mạng giai đoạn 1996–2006:
timeline
    title Tiến trình Phát triển Đồ thị Tấn công (1996 - 2006)
    1996 : NetKuang (Zerkle & Delgrossi) - Expert Systems
    1998 : Phillips & Swiler - Attack Templates & Graph Metrics
    1999 : Ortalo et al. - Probabilistic Attack Graphs (METF)
    2000 : Ritchey & Ammann - Model Checking via SMV
    2002 : Sheyner et al. - Full State-space Generation
         : Ammann et al. - Monotonicity Assumption
    2005 : Lippmann et al. (NetSPA) - Multiple-prerequisite Graphs
    2006 : Ou et al. (MulVAL) - Logic Programming (Datalog)
         : Ritchey (Luận án này) - Host-Centric Multi-layer Graph & Mutation Resiliency
Tổng hợp các trường phái nghiên cứu chính
- Hệ chuyên gia dựa trên luật (Rule-based Expert Systems): Bắt đầu từ hệ thống Kuang và phiên bản phân tán NetKuang (Zerkle & Delgrossi, 1996), sử dụng thuật toán tìm kiếm ngược từ mục tiêu (goal-based backward search) trên hệ điều hành UNIX để phát hiện lỗi cấu hình. Tuy nhiên, NetKuang bị giới hạn trong môi trường cục bộ và thiếu mô hình hóa tương tác mạng tổng thể.
- Khuôn mẫu tấn công và Đồ thị trạng thái (Attack Templates & State Graphs): Phillips & Swiler (1998) và Swiler et al. (2001) đề xuất xây dựng đồ thị từ các khuôn mẫu tấn công (attack templates) kết hợp cấu hình mạng. Mặc dù đưa ra khái niệm trọng số cạnh (attack cost), hệ thống gặp hạn chế nghiêm trọng về khả năng mở rộng khi khớp mẫu đồ thị.
- Kiểm tra mô hình hình thức (Formal Model Checking): Ritchey & Ammann (2000) lần đầu tiên mã hóa cấu hình mạng, lỗ hổng và bất biến an ninh (security invariants) vào công cụ kiểm tra mô hình SMV để trích xuất phản ví dụ (counterexample) làm đường dẫn tấn công. Kế thừa ý tưởng này, Jha et al. (2002) và Sheyner et al. (2002, 2004) mở rộng bộ kiểm tra mô hình để tìm tất cả các đường dẫn vi phạm bất biến, tạo ra đồ thị tấn công toàn diện nhưng vấp phải rào cản NP-complete.
- Mô hình hóa dựa trên giả định đơn điệu (Monotonicity-based Models): Ammann, Wijesekera & Noel (2002) thiết lập bước ngoặt khi đưa ra giả định đơn điệu: kẻ tấn công chỉ tích lũy thêm quyền hạn chứ không bao giờ bị mất đi, và việc đạt được quyền hạn mới không làm giảm các khai thác khả dụng. Trên cơ sở đó, công cụ Phân tích Lỗ hổng Cấu trúc (Topological Vulnerability Analysis - TVA) ra đời (Jajodia et al., 2003; Noel et al., 2003), tính toán biện pháp phòng thủ tối thiểu bằng đại số Boole.
- Mô hình lập trình logic và Đồ thị tiền điều kiện rút gọn: Ou et al. (2006) phát triển công cụ MulVAL sử dụng Prolog/Datalog để suy luận logic về đường dẫn tấn công trên quy mô 1.000 máy chủ. Song song đó, Lippmann et al. (2005, 2006) tại MIT Lincoln Laboratory phát triển NetSPA sử dụng đồ thị đa tiền điều kiện (multiple-prerequisite graphs) để biểu diễn các cuộc tấn công dựa trên chứng chỉ xác thực.
Tranh luận học thuật và Định vị của Luận án
Điểm xung đột cốt lõi trong y văn tồn tại giữa hai quan điểm:
- Quan điểm 1 (Sheyner et al., 2002): Cho rằng một đồ thị tấn công chỉ có giá trị khi nó biểu diễn toàn bộ không gian trạng thái và tất cả các chuỗi khai thác tối thiểu có thể có.
- Quan điểm 2 (Ritchey; Ammann et al., 2002): Khẳng định rằng việc tìm kiếm tất cả các đường dẫn là không khả thi về mặt tính toán trên mạng thực tế và không cần thiết cho việc ra quyết định an ninh. Quản trị viên chỉ cần xác định tập hợp tất cả các cặp máy chủ có thể bị xâm phạm (source-target reachability) và mức quyền truy cập tối đa mà kẻ tấn công có thể đạt được.
Luận án của Ritchey định vị chính xác vào khoảng trống này: Kết hợp độ chân thực sâu của mô hình mạng đa tầng (TCP/IP Multi-layer) với đồ thị hướng máy chủ (Host-Centric Attack Graph) có độ phức tạp thuật toán đa thức, đồng thời tiên phong đưa kỹ thuật phân tích biến dị từ công nghệ phần mềm vào đánh giá độ kiên cường an ninh mạng.
Đóng góp lý thuyết và Khung phân tích
classDiagram
    class NetworkModel {
        +Set~Host~ hosts
        +Matrix~Connectivity~ connectivity
        +Set~Exploit~ exploits
        +findMaximalAccess()
        +mutateModel()
    }
    class Host {
        +String hostID
        +Set~Vulnerability~ vulnerabilities
        +AccessLevel currentAccess
    }
    class Connectivity {
        +LINK_ARP
        +LINK_SNIFF
        +TRANS_SERVICE
        +TRANS_UNUSED
        +APP_PW_AUTH
        +APP_RHOSTS
    }
    class Exploit {
        +Set~Vulnerability~ requiredVulns
        +AccessLevel sourceAccess
        +Connectivity requiredConn
        +AccessLevel targetResultAccess
    }
    class AccessLevel {
        <<enumeration>>
        NONE
        PASS_THROUGH
        USER
        ROOT
    }

    NetworkModel "1" *-- "many" Host
    NetworkModel "1" *-- "1" Connectivity
    NetworkModel "1" *-- "many" Exploit
    Host --> AccessLevel
    Exploit --> AccessLevel
Đóng góp cho lý thuyết An ninh Mạng
Luận án mở rộng lý thuyết tiếp cận trạng thái an ninh mạng qua việc hình thức hóa mô hình mạng thành bộ 4 thành phần $M = (H, C, E, A)$:
- $H$ là tập hợp các máy chủ, mỗi máy chủ $h \in H$ được xác định bởi tập thuộc tính cấu hình và lỗ hổng $V(h)$.
- $C \subseteq H \times H \times L$ là ma trận liên thông đa tầng biểu diễn khả năng truyền thông trên các tầng giao thức $L = {\text{Link}, \text{Network}, \text{Transport}, \text{Application}}$.
- $E$ là tập các kỹ thuật khai thác (exploits), trong đó mỗi exploit $e \in E$ là một hàm chuyển trạng thái từ điều kiện tiên quyết $(\text{Precond}_e)$ sang hậu điều kiện $(\text{Postcond}_e)$.
- $A: H \rightarrow {\text{None}, \text{Pass-through}, \text{User}, \text{Root}}$ là hàm gán mức quyền hạn hiện tại của kẻ tấn công trên từng máy chủ.
"Attack graph construction and analysis can be automated while maintaining characteristics of real networks, that attack graphs can be used to assess the resiliency of candidate enterprise networks and that attack graphs can be scaled to enterprise sized networks." (Trích dẫn trực tiếp từ Luận án, Chương 1, Trang 2).
Luận án đưa ra các định đề lý thuyết then chốt:
- Định đề 1 (Sự chuyển dịch tiêu điểm tấn công - Locus of Attack Shifting): Kẻ tấn công có thể tận dụng một máy chủ trung gian bị xâm nhập làm bàn đạp (pivot) để thay đổi điểm xuất phát của các kết nối mạng, từ đó vô hiệu hóa hoàn toàn các chính sách tường lửa biên (perimeter firewall rules).
- Định đề 2 (Đẳng cấu biến dị an ninh - Security Mutation Equivalence): Một biến dị mạng (như nới lỏng luật tường lửa hoặc thêm lỗ hổng giả định) được gọi là "sống sót" (survived mutant) nếu nó tạo ra ít nhất một đường dẫn tấn công mới dẫn tới mục tiêu trọng yếu mà mô hình gốc không có; ngược lại, biến dị bị "tiêu diệt" (killed mutant) hoặc đẳng cấu nếu nó không làm thay đổi trạng thái quyền truy cập tối đa của mạng.
Khung phân tích độc đáo: Mô hình hóa Đa tầng TCP/IP
Ritchey xây dựng hệ thống biến liên thông mang tính đột phá, thay thế việc theo dõi 65.536 cổng TCP/UDP thuần túy bằng các biến định danh ứng dụng ngữ nghĩa:
| Tầng Giao thức |
Biến Liên thông |
Ý nghĩa An ninh & Cơ chế Khai thác |
| Link Layer |
LINK_ARP |
Xác định các host cùng chia sẻ một broadcast domain; điều kiện tiên quyết cho tấn công chiếm quyền điều khiển phiên (TCP session hijacking) và đầu độc ARP. |
| Link Layer |
LINK_SNIFF |
Xác định khả năng nghe lén gói tin; phân biệt rõ giữa môi trường mạng dùng Hub (bắt được toàn bộ lưu lượng) và Switch (chỉ bắt được gói tin unicast tới host hoặc broadcast). |
| Transport Layer |
TRANS_SERVICE (e.g., TRANS_IIS, TRANS_APACHE) |
Biểu diễn khả năng kết nối tới tiến trình ứng dụng cụ thể; loại bỏ sự phụ thuộc vào số hiệu cổng (port number), xử lý tự nhiên trường hợp dịch vụ chạy trên cổng phi tiêu chuẩn. |
| Transport Layer |
TRANS_UNUSED |
Đại diện cho các cổng mở trên tường lửa nhưng không có dịch vụ lắng nghe phía sau; điều kiện tiên quyết cho kỹ thuật chuyển tiếp cổng (Port Forwarding). |
| Application Layer |
APP_PW_AUTH |
Đại diện cho kênh xác thực mật khẩu người dùng (Telnet, FTP, SSH). |
| Application Layer |
APP_RHOSTS |
Đại diện cho quan hệ ủy thác tin cậy dựa trên địa chỉ IP (Berkeley r-commands: rsh, rcp, rlogin). |
Đặc biệt, Ritchey bổ sung mức quyền truy cập Pass-through (bên cạnh None, User, Root). Mức quyền này cho phép một máy chủ đóng vai trò làm trung gian chuyển tiếp dữ liệu (ví dụ: FTP bounce attack) mà kẻ tấn công không nhất thiết phải có quyền thực thi mã lệnh trên máy chủ đó.
Phương pháp nghiên cứu tiên tiến
Thiết kế nghiên cứu và Triết lý khoa học
Nghiên cứu áp dụng triết lý thực chứng (Positivism) kết hợp phương pháp mô hình hóa tính toán hình thức (Formal Computational Modeling) và thực nghiệm mô phỏng thuật toán. Quy trình nghiên cứu được thiết kế với tính chặt chẽ cao, bao gồm việc giải bài toán tiếp cận trên đồ thị có hướng (Directed Graph Reachability) để tìm kiếm trạng thái truy cập cực đại (Maximal Access State).
Thuật toán cốt lõi và Mã giả hình thức
Thuật toán trung tâm của luận án là findMaximalAccess và thuật toán kiểm tra biến dị potentialNewMaximalAccess, giải quyết bài toán tiếp cận bằng phương pháp bao đóng bắc cầu (Transitive Closure):
Algorithm: findMaximalAccess(NetworkModel M)
Input: Graph G = (V, E), Connectivity Matrix C, Initial Access A_0
Output: Maximal Access Matrix A_max

1. Initialize A_curr = A_0
2. Repeat:
3.    Changed = False
4.    For each host h_src in V where Access(h_src) >= User do:
5.        For each host h_dst in V where C(h_src, h_dst) exists do:
6.            For each exploit e in Exploits(h_dst) do:
7.                If Preconditions(e) subset of (Access(h_src) U Vulns(h_dst) U C(h_src, h_dst)) then:
8.                    NewAccess = EvaluatePostconditions(e, Access(h_dst))
9.                    If NewAccess > Access(h_dst) then:
10.                       Access(h_dst) = NewAccess
11.                       Changed = True
12. Until Changed == False
13. Return Access as A_max
"One of my approach’s core capabilities is it's ability to shift the locus of attack in this way, just as a real attacker would, to work around connectivity limiting facilities such as firewall policies." (Trích dẫn trực tiếp từ Luận án, Chương 5, Trang 27).
flowchart TD
    Start([Khởi tạo Mô hình M & Quyền ban đầu A_0]) --> LoopStart{Có sự thay đổi quyền truy cập?}
    LoopStart -- Có --> PickSrc[Duyệt qua từng máy chủ nguồn h_src có Access >= User]
    PickSrc --> PickDst[Tìm máy chủ đích h_dst có kết nối C_src_dst]
    PickDst --> MatchExp{Khớp điều kiện tiên quyết của Exploit e?}
    MatchExp -- Thỏa mãn --> Elevate[Nâng quyền truy cập trên h_dst: NewAccess > OldAccess]
    Elevate --> MarkChange[Đánh dấu Changed = True]
    MarkChange --> LoopStart
    MatchExp -- Không thỏa --> PickDst
    LoopStart -- Không --> Terminate([Dừng: Trả về Ma trận Quyền hạn Cực đại A_max])
Kỹ thuật Phân tích Biến dị (Mutation Analysis for Network Resiliency)
Lấy cảm hứng từ lý thuyết kiểm thử đột biến phần mềm của GS. Jeff Offutt, Ritchey định nghĩa 2 toán tử biến dị mạng chính:
- Toán tử Thêm Liên thông (Add Connectivity Operator): Biến đổi bảng luật tường lửa (chuyển từ
DENY sang ALLOW cho một cặp IP/Port cụ thể), mô phỏng lỗi cấu hình quản trị hoặc nhu cầu nghiệp vụ mới.
- Toán tử Tăng Quyền / Thêm Lỗ hổng (Add Vulnerability / Increase Access Operator): Gán thêm một siêu lỗ hổng (super-vulnerability) hoặc cấp quyền người dùng cục bộ trên một máy chủ nội bộ, mô phỏng nguy cơ từ kẻ tấn công nội gián (insider threat) hoặc lỗ hổng zero-day chưa công bố.
Phát hiện đột phá và Implications
Những phát hiện then chốt từ thực nghiệm
graph LR
    subgraph External_Zone ["Vùng Ngoài (Internet)"]
        Attacker["Attacker (Smithers)"]
    end

    subgraph DMZ_Zone ["Vùng Phân đoạn DMZ"]
        Web["Web Server (Maude / Homer)<br/>IIS 4.0 / Apache<br/>TCP 80, 8080"]
    end

    subgraph Internal_Zone ["Vùng Mạng Nội bộ (Private LAN)"]
        FileServer["File Server (Ned / Marge)<br/>Sendmail 8.10.2 / NFS / FTP<br/>TCP 21, 25"]
    end

    Attacker -- "1. Exploit IIS Buffer Overflow (TRANS_IIS)" --> Web
    Web -- "2. Download Port-Forward Tool via RCP (APP_RHOSTS)" --> Attacker
    Attacker -- "3. Setup Port-Forward via TRANS_UNUSED" --> Web
    Web -- "4. Pivot Attack to Internal FTP/Sendmail" --> FileServer

    style Attacker fill:#f9d5e5,stroke:#333,stroke-width:1px
    style Web fill:#eeeeee,stroke:#333,stroke-width:1px
    style FileServer fill:#d5e8d4,stroke:#333,stroke-width:1px
- Khả năng bẻ gãy tường lửa biên qua dịch chuyển tiêu điểm tấn công:
Trong kịch bản thực nghiệm mạng chứa máy chủ Web (
Maude chạy IIS 4.0 trên cổng TCP 80) và máy chủ nội bộ (Ned chạy dịch vụ FTP/Sendmail trên cổng TCP 21, 25), tường lửa chặn toàn bộ truy cập trực tiếp từ Internet vào Ned. Luận án chứng minh rằng kẻ tấn công từ bên ngoài (attack machine) có thể khai thác lỗ hổng tràn bộ đệm trên IIS của Maude để chiếm quyền thực thi mã lệnh (ACCESS_EXEC). Từ Maude, kẻ tấn công lợi dụng độ tin cậy của lệnh Berkeley rcp (APP_RHOSTS) để tải công cụ chuyển tiếp cổng (PGM_PORT-FWD), biến Maude thành proxy nội bộ trên cổng chưa sử dụng (TRANS_UNUSED), từ đó xâm nhập thành công vào Ned.
- Ảnh hưởng quyết định của cấu trúc chuyển mạch tầng Liên kết (Link Layer):
Thực nghiệm chứng minh sự khác biệt sống còn giữa môi trường Hub và Switch. Trong mạng Hub, chỉ cần một máy chủ bị chiếm quyền root, kẻ tấn công kích hoạt chế độ promiscuous mode để thu thập thông tin xác thực dạng bản rõ (
APP_PW_AUTH) của tất cả các phiên Telnet/FTP trong subnet. Trong môi trường Switch, phạm vi thu thập bị cô lập hoàn toàn, buộc kẻ tấn công phải chuyển hướng sang kỹ thuật đầu độc ARP (LINK_ARP), làm tăng chi phí và dấu vết tấn công.
- Phát hiện đường dẫn tấn công liên tổ chức khi sáp nhập mạng (Inter-organizational Network Merging):
Luận án phân tích kịch bản sáp nhập mạng giữa Nhà cung cấp (Supplier) và Khách hàng (Customer) qua kết nối B2B/VPN. Thuật toán
addEdgeBetweenNetworks chứng minh rằng một máy chủ cơ sở dữ liệu nội bộ được coi là an toàn tuyệt đối trong mạng Nhà cung cấp có thể bị thỏa hiệp ngay lập tức sau khi thiết lập một đường truyền dữ liệu duy nhất sang Khách hàng, do chuỗi phụ thuộc lỗ hổng bắc cầu xuyên qua các chính sách kiểm soát biên của cả hai bên.
"With an attack graph, even one built with possibly false vulnerability data, the specific findings that could cause real harm are highlighted. This provides system administrators with useful prioritization allowing them to concentrate on the key issues that could affect their organization." (Trích dẫn trực tiếp từ Luận án, Chương 4, Trang 20).
So sánh Đối chuẩn với các Nghiên cứu Quốc tế Cùng thời
quadrantChart
    title So sánh Đối chuẩn Các Phương pháp Đồ thị Tấn công (1998 - 2006)
    x-axis "Độ phức tạp Tính toán: Cao (Hàm mũ) --> Thấp (Đa thức)"
    y-axis "Độ Chân thực Giao thức: Thấp (Trừu tượng) --> Cao (Đa tầng TCP/IP)"
    quadrant-1 "Tối ưu cho Doanh nghiệp (Ritchey 2006)"
    quadrant-2 "Hình thức nhưng Không mở rộng (Sheyner 2002)"
    quadrant-3 "Mô hình Sơ khai (Phillips & Swiler 1998)"
    quadrant-4 "Mở rộng Tốt nhưng Trừu tượng (Ammann 2002, MulVAL 2006)"
    "Sheyner et al. (CMU 2002)": [0.15, 0.75]
    "Phillips & Swiler (1998)": [0.30, 0.30]
    "Ritchey & Ammann (2000)": [0.25, 0.65]
    "Ammann et al. (TVA 2002)": [0.75, 0.45]
    "NetSPA (MIT Lincoln Lab 2005)": [0.80, 0.70]
    "MulVAL (Ou et al. 2006)": [0.85, 0.50]
    "Luận án Ritchey (GMU 2006)": [0.88, 0.92]
| Tiêu chí So sánh |
Mô hình Kiểm tra Mô hình (Sheyner et al., CMU 2002) |
Đồ thị Tiền điều kiện NetSPA (Lippmann et al., MIT Lincoln Lab 2005) |
Mô hình Hướng Máy chủ Đa tầng (Luận án Ritchey, GMU 2006) |
| Độ phức tạp Thuật toán |
$O(2^N)$ (NP-complete) |
$O(N \log N)$ đến $O(N^2)$ |
**$O( |
| Độ chân thực Mạng |
Trừu tượng hóa cao, bỏ qua đặc tính tầng Link |
Phân loại trạng thái truy cập, hỗ trợ chứng chỉ |
Đầy đủ 4 tầng TCP/IP (ARP, Sniff, Unused ports, Trust) |
| Khả năng Đánh giá Kiên cường |
Không (chỉ tìm đường dẫn tĩnh) |
Không hỗ trợ phân tích biến dị |
Tích hợp Phân tích Biến dị (Mutation Testing) |
| Khả năng Phân tích Sáp nhập Mạng |
Không có thuật toán chuyên biệt |
Hạn chế trong một cấu trúc mạng đơn |
Có thuật toán addEdgeBetweenNetworks cho mạng B2B |
| Khả năng Ứng dụng Thực tế |
Mạng dưới 20 máy chủ |
Hàng nghìn máy chủ |
Mạng doanh nghiệp phân tán quy mô lớn |
Hàm ý Đa chiều (Multidimensional Implications)
- Hàm ý Lý thuyết: Chứng minh tính hợp lệ và vượt trội của nguyên lý tiếp cận đơn điệu kết hợp mô hình hóa ngữ nghĩa giao thức, mở ra hướng đi mới trong việc nghiên cứu tương tác lỗ hổng thay vì chỉ đánh giá lỗ hổng tĩnh.
- Hàm ý Thực tiễn: Cho phép các Trung tâm Giám sát An ninh (SOC) và Quản trị viên hệ thống tối ưu hóa nguồn lực vá lỗi (Remediation ROI). Thay vì phải xử lý hàng nghìn cảnh báo vô hại, quản trị viên chỉ cần vá chính xác 1 hoặc 2 lỗ hổng đóng vai trò "nút thắt cổ chai" (choke points) trên đồ thị là có thể triệt tiêu toàn bộ đường tấn công vào vùng dữ liệu nhạy cảm.
Limitations và Future Research
Hạn chế của Luận án (Specific Limitations)
- Ràng buộc của Giả định Đơn điệu (Monotonicity Boundary): Giả định kẻ tấn công không bao giờ mất quyền hạn khiến mô hình không thể mô phỏng chính xác các cuộc tấn công từ chối dịch vụ (Denial of Service - DoS làm sập dịch vụ trung gian), các cuộc tấn công làm thay đổi cấu hình tường lửa động, hoặc các cơ chế phòng thủ chủ động như tự động thu hồi chứng chỉ xác thực.
- Sự phụ thuộc vào độ chính xác của Scanner Đầu vào: Nếu các công cụ quét lỗ hổng (Nessus, Foundstone) bỏ sót lỗ hổng (False Negatives), đồ thị tấn công sẽ không thể dự đoán được các đường dẫn qua các lỗ hổng bị ẩn đó.
- Mô hình hóa Thủ công cho các Khai thác Mới: Việc định nghĩa các tiền điều kiện và hậu điều kiện cho từng loại exploit đòi hỏi kiến thức chuyên gia sâu và chưa có cơ chế tự động trích xuất trực tiếp từ các kho lưu trữ tri thức như CVE/NVD tại thời điểm năm 2006.
Chương trình Nghiên cứu Tương lai (Future Research Directions)
- Tích hợp số liệu xác suất (Probabilistic Attack Graphs) và thời gian thực hiện tấn công (Mean Effort To security Failure - METF của Ortalo et al., 1999).
- Xây dựng cơ chế tự động ánh xạ thông tin lỗ hổng từ chuẩn XML/OVAL và cơ sở dữ liệu quốc gia NVD vào các toán tử khai thác của đồ thị.
- Mở rộng thuật toán để phân tích các mạng chuyển mạch ảo (VLAN) phức tạp, mạng không dây (Wireless 802.11) và các hệ thống phòng thủ chủ động (Intrusion Prevention Systems - IPS).
Tác động và ảnh hưởng
graph TD
    subgraph Academic_Legacy ["Tác động Học thuật & Nghiên cứu"]
        C1[Hơn 500+ trích dẫn học thuật]
        C2[Nền tảng cho công cụ TVA, MulVAL, NetSPA]
        C3[Mở ra nhánh Phân tích Tương quan IDS]
    end

    subgraph Industry_Defense ["Chuyển đổi Thực tiễn Công nghiệp & Quốc phòng"]
        I1[Ứng dụng tại Booz Allen Hamilton & Bộ Quốc phòng Mỹ]
        I2[Tích hợp vào các giải pháp Attack Path Management thương mại]
        I3[Chuẩn hóa mô hình đánh giá rủi ro kiến trúc mạng]
    end

    LuatAn["Luận án TS: Efficient Network Attack Graph Generation (Ritchey 2006)"] --> Academic_Legacy
    LuatAn --> Industry_Defense
- Tác động Học thuật: Công trình của Ritchey cùng các nghiên cứu liên kết với GS. Paul Ammann và GS. Sushil Jajodia đã trở thành tài liệu kinh điển trong lĩnh vực an ninh mạng, thu hút hàng trăm lượt trích dẫn và tạo cảm hứng cho hàng loạt luận án tiến sĩ tiếp theo tại các đại học hàng đầu (CMU, MIT, GMU, KAIST).
- Tác động Công nghiệp và Quốc phòng: Nghiên cứu bắt nguồn trực tiếp từ nhu cầu thực tiễn của tập đoàn tư vấn chiến lược Booz Allen Hamilton và các chương trình an ninh quốc phòng Hoa Kỳ. Các thuật toán trong luận án đã được chuyển giao vào các hệ thống đánh giá tư thế an ninh mạng (Cyber Security Posture Assessment) phục vụ cho các cơ quan chính phủ và doanh nghiệp Fortune 500.
Đối tượng hưởng lợi
- Nghiên cứu sinh Tiến sĩ & Nhà khoa học: Cung cấp khung phương pháp luận hình thức mẫu mực trong việc mô hình hóa hệ thống phức tạp và kết hợp lý thuyết phần mềm (Mutation Analysis) với an ninh mạng.
- Kỹ sư An ninh Mạng & Quản trị Hệ thống (SecOps/SOC): Cung cấp thuật toán và công cụ để định lượng rủi ro, ưu tiên vá lỗ hổng tối ưu và thiết kế chính sách tường lửa phòng thủ theo chiều sâu.
- Giám đốc An toàn Thông tin (CISO) & Nhà hoạch định Chính sách: Cung cấp phương pháp định lượng để đánh giá độ kiên cường an ninh trước khi phê duyệt sáp nhập hạ tầng công nghệ thông tin liên doanh nghiệp (M&A / B2B Interconnections).
Câu hỏi chuyên sâu
1. Đóng góp lý thuyết độc đáo nhất của luận án là gì và đã mở rộng lý thuyết nào?
Đóng góp lý thuyết độc đáo nhất là việc kết hợp thuyết phân tích biến dị phần mềm (Software Mutation Theory của DeMillo, Lipton & Sayward, 1978; Offutt, 1995) với lý thuyết tiếp cận đồ thị an ninh. Luận án đã mở rộng khái niệm "biến dị mã nguồn" thành "biến dị cấu hình mạng" để đánh giá định lượng khả năng chịu đựng của kiến trúc an ninh trước các lỗ hổng zero-day mà không cần biết trước mã khai thác cụ thể.
2. Đột phá phương pháp luận so với các nghiên cứu trước đây thể hiện ra sao?
So với phương pháp kiểm tra mô hình đầy đủ của Sheyner et al. (2002) (vốn rơi vào bẫy bùng nổ không gian trạng thái $O(2^N)$), và phương pháp mẫu đồ thị của Phillips & Swiler (1998), phương pháp của Ritchey sử dụng mô hình hướng máy chủ (Host-Centric Model) dựa trên giả định đơn điệu (Monotonicity) kết hợp các biến trừu tượng hóa ngữ nghĩa giao thức tầng cao (TRANS_SERVICE, LINK_SNIFF, TRANS_UNUSED). Điều này giúp giảm độ phức tạp thuật toán xuống thời gian đa thức $O(|V| \cdot |E|)$, cho phép xử lý mạng thực tế quy mô lớn.
3. Phát hiện bất ngờ nhất trong quá trình thực nghiệm là gì?
Phát hiện bất ngờ nhất là kỹ thuật vượt tường lửa thông qua cổng chưa sử dụng (TRANS_UNUSED) kết hợp lệnh rcp ngược. Kẻ tấn công không cần tấn công trực diện vào dịch vụ bị tường lửa chặn, mà chiếm quyền điều khiển máy chủ Web công khai, ép máy chủ này dùng quyền tin cậy nội bộ tải công cụ chuyển tiếp cổng về máy của chính kẻ tấn công, sau đó thiết lập đường hầm bí mật vào các máy chủ nội bộ sâu trong mạng.
4. Luận án có cung cấp quy trình tái lập (Replication Protocol) không?
Có. Luận án cung cấp chi tiết toàn bộ cấu trúc ma trận liên thông (Connectivity Matrices), bảng luật tường lửa biên, danh mục mã khai thác (Exploit Rules với đầy đủ pre/post-conditions) và mã giả hình thức cho các thuật toán findMaximalAccess, potentialNewMaximalAccess, addEdgeBetweenNetworks cùng các sơ đồ cấu hình mạng mẫu (mô phỏng trên nền RedHat Linux và Windows NT).
5. Định hướng chương trình nghiên cứu 10 năm được vạch ra như thế nào?
Chương trình nghiên cứu dài hạn bao gồm: (1) Tự động hóa hoàn toàn việc trích xuất quy tắc khai thác từ văn bản lỗ hổng tự nhiên (NLP for CVE descriptions); (2) Tích hợp đồ thị tấn công với hệ thống phát hiện xâm nhập (IDS Alert Correlation); (3) Mở rộng mô hình để giải quyết bài toán tối ưu hóa chi phí đặt rào chắn phòng thủ (Minimum-cost Network Hardening).
Kết luận
Luận án "Efficient Network Attack Graph Generation" của TS. Ronald W. Ritchey đã tạo nên những đóng góp xuất sắc mang tính nền tảng cho khoa học an ninh thông tin:
- Chuẩn hóa Mô hình hóa Đa tầng TCP/IP: Xây dựng thành công khung mô hình hóa an ninh mạng bao phủ từ tầng Liên kết dữ liệu đến tầng Ứng dụng với các biến ngữ nghĩa mang tính đột phá (
LINK_SNIFF, TRANS_UNUSED, APP_RHOSTS).
- Giải quyết Bài toán Khả năng Mở rộng (Scalability Breakthrough): Xóa bỏ rào cản bùng nổ không gian trạng thái bằng thuật toán thời gian đa thức $O(|V| \cdot |E|)$, đưa đồ thị tấn công từ nghiên cứu lý thuyết trừu tượng thành công cụ có thể triển khai trên mạng doanh nghiệp thực tế.
- Tiên phong Kỹ thuật Đánh giá Độ kiên cường qua Biến dị (Mutation-based Resiliency): Thiết lập phương pháp luận định lượng độ vững chắc của kiến trúc an ninh mạng trước các nguy cơ chưa biết và các mối đe dọa nội gián.
- Hình thức hóa Bài toán Tấn công Chuyển dịch Tiêu điểm (Locus of Attack Shifting): Chứng minh bằng toán học và thực nghiệm cách thức kẻ tấn công bẻ gãy các chính sách tường lửa biên thông qua chuỗi khai thác bắc cầu.
- Thuật toán Phân tích Sáp nhập Mạng Doanh nghiệp: Cung cấp thuật toán đánh giá rủi ro an ninh tự động cho các kết nối liên mạng giữa các tổ chức (B2B/Supply Chain Interconnections).
- Đặt nền móng cho Thế hệ Công cụ Quản lý Bề mặt Tấn công Hiện đại: Các nguyên lý trong luận án trực tiếp định hình các công nghệ hàng đầu hiện nay như Quản lý Đường dẫn Tấn công (Attack Path Management - APM), Phân tích Bề mặt Rủi ro Tiếp xúc (Exposure Management) và Mô phỏng Tấn công & Phòng thủ Tự động (Breach and Attack Simulation - BAS).