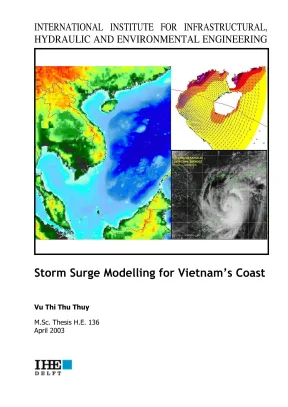
Storm Surge Modelling for Vietnam’s Coast Vu Thi Thu Thuy M. 136 April 2003 THES DELFT TEER INTERNATIONAL INSTITUTE FOR INFRASTRUCTURAL, DEtFt HYDRAULIC AND ENVIRONMENTAL ENGINEERING Storm Surge Modelling for Vietnam’s Coast Master of Science Thesis Thi Thu Thuy Supervisors ‘Assoc. Wang Examination Committee Prof. Petry, IHE, Chairman Prof.
Marcel 3F, Stive, TU Delft ‘Assoc. Hassan, THE Assoc. Wang, TU Delft / WL | Delft Hydraulics Delft, The Netherlands April 2003 Sm Sượ Molino ma Chu ABSTRACT Vietnam is located near the Northwest Pacific Ocean - the largest storm basin of the ‘world. Thus, Vietnam's coast with many coastal works, economical zones as well as high density populated regions, is the most vulnerable ares under typhoons accompanied with serious storm surges.
This is the main reason for the huge damages occuring inthe areas. ‘Storm surges threaten not only safely of people’s lives but also coastal structures ‘Traditional planning, design of coastal projects and coastal zone management usually take {nto account these effects based on their probability distribution of very limited observed data, which results in a low reliability and safety. Therefore, improving the accuracy in determination of these abnormal water level rise during storm is essential for proper planing, design of coastal works as well as integrated coastal zone management. “The objectives ofthis study are: (1) Set up a storm surge model for the Vietnamese coast; (2) Compute storm surges and determine the probability distribution of storm surge for the Vietnamese coasL To achieve these objectives, firstly various models of typhoon wind and pressure are investigated.
Based on observations and criteria of root-mean-squared error, the Fujita ‘model is selected for deseribing typhoon pressure field and the modified Rankine vortex model is chosen for pres núng typhoon wind field, Secondly, Delf.3D-FLOW is used lo simulate storm surge in typhoon condition. The model is set-up for the northern part of the Vietnamese coast where high frequency of storm causing serious storm surges and severe dam 18 occur. The hydrodynamic model is calibrated and validated for both non- storm condition and extreme condition of typhoons. The effects of boundary conditions and model parameters (o the results are evaluated using sensitivity analysis.
Thirdly, based on storm track information, storm surges at various locations along the north coast are computed for the years from 1951 to 2001, And then, some popular statistical distributions such as log-normal, Pearson type IIL, general extreme value, etc. are used to {it with set of storm surge result to model the probability distributions of storm surge and. {extrapolate for long-term return period values of storm surge at these locations. Finally, by evaluation the accuracy of the result for storm surge hind-cast, some suggestions is given for storm surge Forecasting in the area.
‘Sm Sag Maino Vis Co ACKNOWLEDGEMENTS This work has been carried out to meet the requirements of the Master of Science degree ar the Institute for Infrastructural, Hydraulic and Environmental Engineering (IHE), Delft under the financial support ofthe training project HWRU- TU Delft- HE Delft- WL Delft Hydraulic. 1 would like to express my sincere gratitude to all people who have helped me in the study. I thank them all for their support and advice, which contribute to success ofthis study sincerely thank my supervisors: Assoc, Prof Dr. Hassan and Assoc.
Wang for their valuable technical guidance and perpetual ‘encouragement. My sincere thanks to Professor Dr. Le Kim Traven ~ Rector of HWRU, Professor Ir. Kees 'Angremond ~ Team Leader of the HWRU-TU Delfi-IHE Delf-WL Delft Hydraulic Training Project, Mr.
Jan van der Laan — Project Co-ordinator, Assoc. Henk Jan Verhagen (TU Delfi), Ir. Mick van der Wegen (IHE), and Dr. Vu Minh Cat, Department of Scientific Research and International Co-operation, HWRU.
They hhave made efforts for the arrangement of financial support for this research work and have supported or the study of my husband beside me during my'research I wish to express my thanks 10 Dr. Bui Van Duc from Hydro-Meteorological Service of Vietnam and the staff of the Marine Hydro-Meteorological Center: Dr. Nguyen The Tuong, Dr. Bui Dink Khuoc and Dr.
Vu Thank Ca. They together with WL Delf Hydraulics are willing to help me «lot in providing data for this study: 1 also wish to thank all of my colleagues and my friends for their support and encouragement during my stay in Deft T am grateful to my parents, my younger brother, my lovely son and my family on law for their perpetual support, help and encouragement throughout my lif. Last but not least, Iam deeply grateful to my beloved husband for his perpetually technical and moral support during my entire study period, without it this research work ‘would not have been accomplished and succeeded. Delft, April 2003 ‘Vu Thi Thu Thuy Sm Sượ Molino ma Chu TABLE OF CONTENTS Chapter1, Introduction 1.1, General description of the area.2, Threat of storms and storm surges in Vietnam.3, Problem identification 14, Objectives ofthe study 15.
Approach and methodology of study Chapter 2. Descriptions ofthe study area 2.4, Characteristic of storms 25, Features of storm surges 2.6, Previous studies on the area, Chapter 3. Typhoon pressure model 3. Typhoon wind model 3.
Chapter 4, Hydrodynamic model 4.1, Description ofthe hydrodynamic model 4. Setup the hydrodynamic model 4.3, Calibration and validation of the hydrodynamic model 44. Results of storm surge simulation and probability distribution 5. Results of storm surge simulation, 5.
Determination of storm surge probability distribution 5.1, Commonly used probability distributions.2, Statistical criteria and selection of probability distribution, 5.3, Results of storm surge and water level corresponding return period, Chapter 6. Conclusions and recommendations. Recommendations References Appendix A, Models of typhoon wind and atmosphere pre Appendix B, Results of hydrodynamic model calibration and validation Appendix C. Probability distributions of storm surge ‘Sm Sag Maino Vis Co LIST OF EIGURI Figure 1-1, Map of Vietnam and the study area Figure 2-1, Bathymetry of the East Sea Figure 3-1, Best track of typhoon Dan (8929), Frankie (9609), Wukong(0023) and locations of meteorological sation 19 Figure 3-2, The relation between observed and computed pressure of Dan typhoon, 2 Figure 3-3.
The relation between observed and computed pressure of Dan typhoon, 25 Figure 3-4. Sketch of wind velocity field for a moving cyclone Figure 3-5. The relations between observations and computed wind speed {or typhoon Dan after optimised model parameters and C2 coefficient 2 Figure 3-6, The relation between observation and simulation wind field for Dan by using the modified Rankine vortex model 33 Figure 4-1. The model grid and boundary locations.
Model calibration for tides at Do Son. The relationships between V and Cử by different formulas 49 Figure 5-1. Water level at Hon Dau during typhoon Frankie. Storm surge at Hon Dau during typhoon Frankie.
st Figure 5-3, Annual maximum storm surg from 1951 to 2001 3s Figure 5-4, Magnitude of maximum storm surge along the cast. 37 Figure 5-5, Envelop of maximum surges along the coast of typhoon 13-16/10/1988. ot Figure 5-6, Log-normal distribution of storm surge at Do Son 66 Figure 5-7. Pearson type HI distribution of surge at Da Nang a Figure 5-8.
Generalised extreme value distribution of surge at Cua Tung o Sim Sư Mono Vea Chat LIST OF TABLES Table 21 Characteristics of tides along Vietnamese coast lô Table 3-1 ‘Typhoons with observations available 18 Table 3. ‘Radius of max, wind (R) and pressure error of typhoon Dan 9 Table 3-3 ‘Radius of max, wind (R) and pressure error of typhoon Frankie. Radius of max. wind (R) and pressure error of typhoon Wukong.
RMSE for pressure of typhoon Dan 24 Table 36. RMSE for pressure of typhoon Wakong. ‘The parameters and RMSE ofwind simulation for Frankie. 30 Table 38 ‘The model parameters and RMSE of wind simulation for typhoon Dan 3L Table 3.
‘The parameters and RMSE ofwind simulation for Wukong. 31 Table 4-1 Definition ofthe open boundary. ‘Tidal constituent at open boundary (ease B00) 41 ‘Table 3 Tidal constituents at open boundary of the final mode! 46 Table 44 Error of model ealibration for tides 46 Table 45 Error of model calibration for tides plus typhoon so Table S- Percentage of storm surge occurrence in % by grade 59 Table 5. K-Š test for goodness-of-fit for distibutions of storm surge 6 Table 5-3 K-$ test for goodness-of-fit for distributions of maximum water level 70 Table 54.
‘Statistical parameters and 100-year values of storm surges (meters). n ABBREVIATIONS ASCE American Society of Civil Engineers Del3D-FLOW 3Dflow module ofthe Delf3D package developed by WL I Delft Hydraulics cpE cumulative distbution function TOPO? 22 minute Earth topography EVI Extreme Value type I distribution EV? Extreme Value type Hlstribution EV3 Extreme Valve type I distribution GEV General Extreme Value distribution cis Generalised logistic distribution GMT Greenwich Mean Time Ms ‘Vietnam Hydro- Meteorological Services swe Joint Typhoon Warning Center LLG ng logic distribution log-nonhal distribution log: Pearson type I distribution ‘mean se level Northwest Pacifie Ocean root mean squared error [National Chimatie Data Center, USA Pearson type I distribution probability density function peak-over-threshold TOPEX ‘Topography Experiment for ocean circutaion TOPEX/Poseidon Joint US — French orbital mission, launched in 1992 to track changes in ‘sea-level height with radar altimeters UNDP ‘United Nations Development Program USACE US Army Corps of Engineers USD. US Dollars UTM ‘Universal Transverse Mercator vem Vietnam Coast Model VND ‘Vietnam Dong, Vietnamese currency NT ‘Vietnam Local Time Sim Sư Mono Vea Chat LIST OF SYMBOLS 2 Chapter tidal fore number Coriolis parameter amplitude ofthe Ky (Diurallunarsolar declination tide) constituent amplitude of the M, (Semi- dural principle luna tide) constituent Hoy amplitude ofthe O; (Diumal luna dectinaton tide) constituent amplitude ofthe 5. (Som-<iumalprinipe sola tide) constituent parameter of Holland wind model Parameter of deMaria wind model coefficient for moving typhoon center.
empirical coefficient for gradient wind speed fjustrent coefficient for moving typhoon. Allutude of observation tation pressure Pressure at typhoon center almospherie pressure a a speifie location Atmospheric pressure at outskirts of typhoon, radius of maximum wind speed distance from a specific Iocaion to typhoon center atmospheric pressure drop atmospheric pressure drop ‘movement speed of typhoon center wind speed tmaninuim wind spoed r fom typhoon center radient wind speed at a distance ‘pon of wind entvelocity smponent of wind velocity Parameter ofthe modiTed Rankine vortex wind mode angle between gradient wind and isopiestic he direction of typhoon movement tude Pi number. angle ofline connecting point and typhoon center respects to X-axis air density. Earth angular speed De Chéey coelfi ‘wind drag coefficient water depth below datum Coriolis parameter aeeslenl almospheric pressure at a specifi location time variable, wi ‘magnitude of total depth-averaged flow velocity.
wind speed ‘Sm Sag Maino Vis Co wind speed at 10m above fee surface (nls) Adepth-averaged Thos velocity in x-direction (ml) depth averaged flow velocity in y-direction ins) distance along west-east direction distance along south-north direction Water level respects to datum, eddy viscosity ai density water density components of Wind sess Earth angular speed coefficient for calculating confidence interval Tower hound of random variable coetficient of variation coeffiien of skewness ‘cumulative distribution function, probability density function rank ofa Value in series shape parameter of GEV dlistribution length of sample series probability probability of annual maximum series probability of partial duration series. ‘departure parameter ‘random variable (storm surge, wate level. value corresponding to return period of T years upper limit of X; lower limit of X sean value value ofrandom variable shape parameter of pf scale parameter ofp. gamma function standard deviation, CHAPTER 1.
General description of the area Vietnam is located at the centre of Southeast Asia, between 8'02'N - 23°23'N and 102208'E - 109°28'E as shown in Figure 1-1. It is located near the Northwest Pacific Ocean (NPO) where every year the highest number of storms occurs - about 30% of storm occurrences in the world (Le Van Thao eta, 2000). In recent years, the averaged number of stor inthe region has increased gradually, from 22 storms per year before 1980 to currently become 31 storms per year for the time being.