Hanoi University of Science and Technology School of Information and Communication Technology Master Thesis in Data Science Semi-Supervised end-to-end polyp detection NGUYEN HONG SON son.vn Supervisor: Dr. Dinh Viet Sang Hanoi 10-2023 Author’s Declaration I hereby declare that I am the sole author of this thesis. The results in this work are not complete copies of any other works. STUDENT Nguyen Hong Son Contents Contents List of Figures List of Tables 1 Introduction 1 1.4 Outline of the thesis .3 Semi-supervised Learning .1 Object Detection Problem .2 Semi supervised Learning .3 Semi-supervised Object Detection (SSOD) .2 Backbone used in CenterNet baseline .3 Feature Pyramid Network (FPN) .2 Improving Baseline model .3 Dense Target Producer (DTP) .1 Pseudo-Labeling Framework .2 Disadvantages of Pseudo-box Labels .1 CenterNet++ improvement results.
41 5 Conclusion 44 Bibliography 45 List of Figures 1.1 Proportion of CRC compared to other cancer diseases1 .1 Illustration about supervised, unsupervised and semi-supervised learn- ing.2 Two output of Object detection model: boxes and categories 3 .3 Anchor boxes in the object detection task.1 Architecture of Residual Block .2 Architecture of ResNet18 5 .3 Architecture of DLA 6 .4 An example of Hourglass network architecture used for segmentation task.6 Overview architecture of CenterNet++.7 Four module types used in the backbone of CenterNet++ .8 Architecture of ASF module .9 The overview of our proposed pipeline for unlabeled data compared with existing pseudo-box based pipeline. For each iteration, Dense Target Producer (DTP) is generated by the teacher model on unla- beled images. DTPs then use for the student model to calculate the unsupervised loss. The total loss is the sum of supervised loss and unsupervised loss.
Note that DTP does not need any postprocessing steps.10 How object detection methods get positive samples: (b) Anchor-based and anchor-free with NMS assign all pixels inside ground truth box (c) Heatmap-based focus only on the center pixel of the ground truth box. boxes with heatmap-based method .11 Comparisons between (b) foreground pixels assigned by ground truth boxes and (c) foreground pixels assigned by pseudo-boxes .12 Example of describing heatmap values at the beginning and end of the training process.1 Some examples of images in the PolypsSet dataset .2 Examples of IOU between two boxes .3 Example of Precision-Recall curve. The mean Average Precision (mAP) is the area under the curve.4 Examples of Mosaic augmentations .5 Visualizations for PolypsSet 10% two-class. From left to right: With- out DTP (supervised), with DTP and label.
42 List of Tables 4.1 Comparison between CenterNet++ and other object detectors for fully supervised learning on the single-class PolypsSet dataset.2 Comparison between CenterNet++ and other object detectors for fully supervised learning on the two-class PolypsSet dataset.3 Experimental results for semi-supervised learning setting on the Polyps- Set dataset.4 Comparisons on the single-class PolypsSet dataset with semi-supervised learning setting using 10% of training data as labeled .5 Experiments on different backbones of CenterNet++ on the two-class PolypsSet dataset.6 Effectiveness of ASF module and Mosaic augmentations on the single- class PolypsSet dataset.7 Effectiveness of using TEA compared to fixed thresholds. Experi- ments were conducted on the single-class PolypsSet dataset with 1% data used as labeled. 43 List of abbreviations AI Artificial Intelligence ANN Artificial Neural Network CNN Convolutional Neural Network CRC Colorectal Cancer DL Deep Learning DTP Dense Target Producer FC Fully Connected FPN Feature Pyramid Network FPS Frame per second FCOS Fully Convolutional One-Stage Object Detection IOU Intersection Over Union NMS Non Maximum Suppression SSD Single Shot Detection SSOD Semi-supervised Object detection TEA Threshold Epoch Adaptive YOLO You Only Look One Chapter 1 Introduction 1.1 Overview Colorectal Cancer (CRC) is one of the most common types of cancer today. When considering cancer diseases specifically, it ranks third in terms of incidence and even second in terms of mortality.
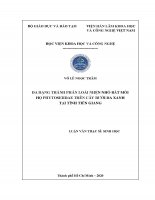
It is estimated that in 2023, there will be approximately 150,000 new cases and 52,000 deaths in the United States [1]. In Vietnam, CRC consistently ranks among the top 10 most common cancer diseases, with the fourth- highest diagnosis rate for males and the third-highest for females. The incidence rate in the population is about 10.1 provides a clearer view of the number and proportion of CRC cases compared to other cancer diseases. The danger of CRC lies in the fact that when symptoms begin to appear and the patient decides to seek medical attention, the disease has already progressed to later stages.
CRC is divided into 5 stages, which increase as the disease worsens. If the disease is detected in the early stages, the 5-year survival rate can be as high as 90%. However, in reality, only about 4 out of 10 cases are detected in the early stages. Therefore, to reduce the incidence and mortality rates, efforts are often made to detect and remove early signs of precancerous abnormalities.
Among these abnormalities, polyps inside the digestive tract, mainly in the colon (referred to as polyps), are considered the most significant cause. Polyps are abnormal growth of tissue that protrudes from the lining of the digestive tract. Polyps are typically divided into two types: neoplastic and non-neoplastic. Non-neoplastic polyps are benign and can be further divided into hyperplastic, in- flammatory, and hamartomatous types.
Neoplastic polyps are malignant and have the potential to develop into cancer. They can be further divided into adenomatous and serrated types. To detect polyps, doctors use a method called gastrointesti- nal endoscopy. This involves using an endoscope - a tube with a light and camera 1 Source: https://gco.fr/today/data/factsheets/populations/704-viet-nam-fact- sheets.1: Proportion of CRC compared to other cancer diseases1 attached that projects images onto a color TV screen - to examine the inside of the digestive tract.
The effectiveness of endoscopy depends on the skill of the doc- tor performing the procedure. According to statistics [2], about 25% of polyps are missed during endoscopy, which poses a significant risk to the patient. In order to reduce this high-risk rate, attention is paid to two things: • Improve the quality of machines and tools used for endoscopy. • Using Artificial Intelligence (AI) or specifically Deep Learning (DL) models as a diagnostic aid.
This second direction has shown a relatively significant effect, reducing the miss rate by up to 50% [3]. The problem used to support colonoscopy is called Polyps detection. Its goal is to locate all polyps in a frame or a video. DL models of Polyps detection task need to use a large amount of labeled data during training in order to perform well.
This has faced a number of challenges such as: • Lack of availability of public datasets. • Labeling this data requires someone knowledgeable about polyps, usually a doctor. • It is sometimes difficult for labelers to agree on the size and type of polyps in a data sample. In addition, the characteristics of polyps such as small size, diverse shapes, and colors also pose challenges in the labeling process.
Therefore, the amount of labeled data used for polyp detection is quite limited. Conversely, the number of endoscopy videos is very large and continuously increasing, which is considered a huge amount 2 of unlabeled data. This is where semi-supervised object detection (SSOD) methods come into play. The models applied in SSOD are usually a type of well-known object detection models [4, 5, 6].
These models all have at least one of two components, Anchor and Non-maximum suppression (NMS). Although these components help the model achieve good performance, they significantly reduce inference speed. A new type of model that does not use Anchor or NMS, called heatmap-based end- to-end [7, 8], has been proposed to address these issues. In this study, we applied semi-supervised learning to a heatmap-based end-to-end model to take advantage of both.2 Objectives The objective of this study is to effectively apply SSOD to a heatmap-based end-to- end model in order to achieve a highly accurate and fast model.
Considering specific datasets, the model demonstrates superior results compared to existing methods. We hope that our model can be applied to many endoscopes in hospitals.3 Main contributions The main contributions of this study: • We propose a novel heatmap-based end-to-end model called CenterNet++ to improve the accuracy and inference speed over the original CenterNet model. • We propose a novel SSOD method called Dense Target Producer (DTP), which can perform end-to-end without the need for any non-differentiable postpro- cessing steps, and can be applied to heatmap-based end-to-end object detec- tors. To my knowledge, this is the first attempt to apply SSOD to a heatmap- based end-to-end model.
• We propose a dynamic thresholding procedure called Threshold Epoch Adap- tor (TEA) to adaptively filter unreliable pseudo labels based on the learning status of the models. • Conduct experiments on a large benchmark dataset, namely PolypsSet. The results show that our DTP improves the AP performance compared to the supervised baseline model and outperforms other SSOD methods.4 Outline of the thesis The rest of this thesis is organized as follows: 3 Chapter 2 presents an overview and related work of this study’s field. Chapter 3 describe in detail the method which apply SSOD to heatmap-based end- to-end model.
Chapter 4 presents the content of the experiments, the results obtained, and some ablation studies results. Chapter 5 concludes the thesis. 4 Chapter 2 Theoratical basis 2.1 Learning Type Based on the type of data input into the machine learning model, it can be cat- egorized into several learning types, namely supervised, unsupervised, and semi- supervised learning. Additionally, there exist other learning types such as self- supervised, weakly-supervised, and reinforcement learning, which, however, are not mentioned within the scope of this research.1: Illustration about supervised, unsupervised and semi-supervised learn- ing.1 Supervised Learning Supervised learning utilizes training data consisting of input-output pairs, where the models learn from this labeled data to make predictions for future data.
During 1 Source: https://blog.com/what-is-semi-supervised-learning/ 5 the learning process, the model predicts the output for the training data and then calculates the adjustment amount based on the difference between the predicted out- put and the actual label. This adjustment helps improve the model’s performance. There are two main tasks in supervised learning: • Classification: The objective of the problem is to find a model that correctly assigns data samples to their respective classes. The label in this problem is an identifier (usually a numerical value) for the class to which the data belongs, and the model aims to accurately predict this label for unseen data samples.
Classification has different use cases, such as spam filtering, customer behavior prediction, and document classification. • Regression: The objective of the problem is to develop a model that synthe- sizes the features of the input parameters to generate continuous real-valued output results. It aids in the forecasting of continuous variables, such as Mar- ket Trends and Home Prices.2 Unsupervised Learning Unsupervised learning uses machine learning algorithms to analyze and cluster unla- beled datasets. These algorithms discover hidden patterns or data groupings without the need for human intervention.
Unsupervised learning models are utilized for three main tasks—clustering, association, and dimensionality reduction. • Clustering is a technique that groups unlabeled data based on their similari- ties or differences. Clustering algorithms are used to process raw, unclassified data objects into groups represented by structures or patterns in the informa- tion. Clustering algorithms can be categorized into a few types, specifically exclusive, overlapping, hierarchical, and probabilistic.
• Association Rules is a rule-based method for finding relationships between variables in a given dataset. These methods are frequently used for market bas- ket analysis, allowing companies to better understand relationships between different products. Examples of this can be seen in Amazon’s “Customers Who Bought This Item Also Bought” or Spotify’s ”Discover Weekly” playlist. While more data generally yields more accurate results, it can also impact the performance of machine learning algorithms (e.
overfitting) and it can also make it difficult to visualize datasets. Dimensional- ity reduction is a technique used when the number of features, or dimensions, in a given dataset, is too high.