Tổng quan về luận án
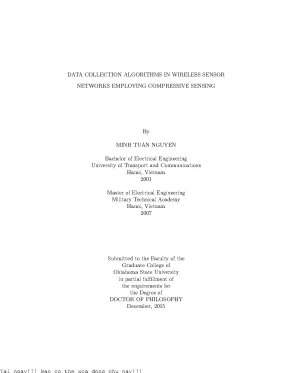
Luận án tiến sĩ với tiêu đề "Data Collection Algorithms in Wireless Sensor Networks Employing Compressive Sensing" do tác giả Minh Tuấn Nguyễn thực hiện tại Oklahoma State University (dưới sự hướng dẫn của GS. Keith A. Teague và hội đồng chuyên môn gồm GS. George Scheets, GS. Qi Cheng, GS. Johnson Thomas) là một công trình tiên phong trong việc giải quyết nghịch lý cố hữu của Mạng cảm biến không dây (Wireless Sensor Networks - WSNs): sự mâu thuẫn gay gắt giữa nhu cầu thu thập dữ liệu mật độ cao, độ chính xác tuyệt đối và giới hạn năng lượng khắc nghiệt của các nút cảm biến hoạt động bằng pin. Trong kiến trúc WSN truyền thống, việc truyền tải toàn bộ dữ liệu cảm biến thô $N$ về trạm gốc (Base Station - BS) tuân theo định lý lấy mẫu Shannon-Nyquist kinh điển không chỉ tiêu tốn tài nguyên vô tuyến mà còn gây ra hiện tượng "lỗ hổng năng lượng" (energy hole problem), làm cạn kiệt sớm các nút gần trạm gốc có nhiệm vụ chuyển tiếp đa chặng (multi-hop relaying).
Khoảng trống nghiên cứu (research gap) trọng tâm mà luận án xác định là: Mặc dù lý thuyết Cảm nhận nén (Compressive Sensing - CS) do Candès, Romberg, Tao (2006) và Donoho (2006) khởi xướng đã chứng minh khả năng tái tạo tín hiệu thưa (sparse signal) hoàn hảo với số lượng mẫu đo $M \ll N$, việc tích hợp ma trận đo ngẫu nhiên vào các cấu trúc liên kết mạng thực tế (như đường truyền ngẫu nhiên, phân cụm, cây định tuyến, và vùng lân cận) mà không làm tăng chi phí truyền thông cục bộ vẫn là một bài toán chưa có lời giải tối ưu. Các nghiên cứu trước đó thường giả định ma trận đo ngẫu nhiên dày đặc (dense Gaussian measurement matrices) phi thực tế, đòi hỏi mọi nút phải giao tiếp đồng bộ toàn mạng, vô hình trung triệt tiêu lợi ích tiết kiệm năng lượng của CS.
Luận án thiết lập hệ thống 4 câu hỏi nghiên cứu ($RQ$) và 4 giả thuyết khoa học ($H$) tương ứng:
- $RQ_1$: Làm thế nào để xây dựng ma trận đo CS thông qua bước đi ngẫu nhiên (Random Walk) mà vẫn đảm bảo đặc tính đẳng cự hạn chế (Restricted Isometry Property - RIP) và tối ưu hóa năng lượng truyền dẫn? $\rightarrow \mathbf{H_1}$: Tồn tại một bán kính truyền dẫn tối ưu $R^$ và độ dài bước đi ngẫu nhiên $\tau^$ cho phép cực tiểu hóa năng lượng tiêu thụ toàn mạng trong khi vẫn đảm bảo độ bao phủ mẫu.
- $RQ_2$: Cấu trúc phân cụm có thể kết hợp với ma trận đo khối đường chéo (block diagonal matrices) như thế nào để tối ưu hóa việc phân bổ mẫu đo? $\rightarrow \mathbf{H_2}$: Việc phân bổ tỷ lệ mẫu đo $T = M_i / M$ chính xác bằng tỷ lệ số nút trong cụm $N_i / N$ sẽ cực tiểu hóa sai số tái tạo tín hiệu.
- $RQ_3$: Việc định tuyến thu thập dữ liệu dạng cây kết hợp ma trận chiếu thưa (sparse projection matrix) có vượt trội hơn cấu hình cây đo lường truyền thống (MTT) không? $\rightarrow \mathbf{H_3}$: Thuật toán thu thập cây đề xuất (TCS) giảm thiểu đáng kể số chặng truyền và năng lượng tiêu thụ so với MTT khi xác suất phần tử khác không $p$ giảm.
- $RQ_4$: Cơ chế lấy mẫu theo vùng lân cận đồ thị (Neighborhood-based CS) có thể loại bỏ hoàn toàn nhu cầu duy trì bảng định tuyến toàn cục mà vẫn bảo toàn độ chính xác tái tạo không? $\rightarrow \mathbf{H_4}$: Việc tổng hợp dữ liệu cục bộ trong $M$ vùng lân cận ngẫu nhiên tạo ra ma trận đo thưa thỏa mãn điều kiện phục hồi tín hiệu với mức tiêu hao năng lượng thấp nhất.
Khung lý thuyết của luận án tích hợp chặt chẽ giữa Lý thuyết Cảm nhận nén ($l_1$-norm minimization, Transform Sparsity), Lý thuyết Đồ thị và Quá trình ngẫu nhiên Markov (Markov Random Walks, Mixing Time), cùng Mô hình tiêu thụ năng lượng vô tuyến bậc một (First-Order Radio Energy Model). Luận án khảo sát quy mô mạng thực nghiệm từ $N = 500$ đến $N = 2000$ nút cảm biến được phân bố ngẫu nhiên trong không gian $100 \times 100$ hoặc hình tròn bán kính $R_0 = 50$, chứng minh rằng chỉ cần $M = 90$ phép đo (đối với $N = 500$) hoặc $M = 500$ phép đo (đối với $N = 2000$), mạng đã có thể phục hồi dữ liệu hoàn chỉnh với sai số tái tạo $\text{MSE} < 0.1$, kéo dài tuổi thọ mạng gấp nhiều lần so với các giao thức kinh điển.
Literature Review và Positioning
Tổng quan y văn trong luận án hệ thống hóa ba dòng nghiên cứu chính trong kỹ thuật mạng cảm biến không dây:
- Các giao thức phân cấp và phân cụm (Hierarchical / Clustered Routing):
Dòng nghiên cứu bắt đầu với giao thức LEACH (Heinzelman et al., 2000), nơi các nút tự đề cử làm Cluster Head (CH) theo xác suất ngẫu nhiên $P_i(t)$. Tiếp theo, HEED (Younis & Fahmy, 2004) cải tiến việc chọn CH dựa trên năng lượng dư thừa $E_{\text{residual}}$ và chi phí truyền thông nội cụm. Để xử lý sự mất cân bằng năng lượng do lưu lượng chuyển tiếp đa chặng dồn về phía trạm gốc, EEUC (Li et al., 2005) và MRPUC (2010) đề xuất kích thước cụm không đồng đều (unequal clustering), trong đó các cụm gần trạm gốc có bán kính nhỏ hơn $R_{\text{comp}}$ để tiết kiệm năng lượng chuyển tiếp liên cụm. Các biến thể khác như HEECH (2008) chia mạng thành 6 đường tròn đồng tâm, PEACH (2007) khai thác tính năng nghe lén gói tin (overhearing), và FLOC (2003) sử dụng mô hình vô tuyến băng tần kép.
- Các giao thức định tuyến phẳng và định vị (Flat & Location-Based Routing):
Bao gồm Directed Diffusion (Intanagonwiwat et al., 2003) dựa trên cơ chế lan truyền sự quan tâm (interest diffusion) và thiết lập gradient; SPIN (Kulik et al., 2002) đàm phán meta-data chống dư thừa; Rumor Routing (Braginsky & Estrin, 2002); GAF (Xu et al., 2001) chia lưới ảo để điều khiển chế độ ngủ/thức; và GEAR (Yu et al., 2001) định tuyến dựa trên thông tin địa lý.
- Ứng dụng Cảm nhận nén trong WSN (Compressive Sensing in WSNs):
Các nghiên cứu ban đầu của Haupt et al. (2008), Luo et al. (2009) áp dụng CS thuần túy nhưng yêu cầu ma trận đo trù mật (dense measurement matrix), dẫn đến việc mỗi phép đo phải tích lũy dữ liệu từ tất cả $N$ nút, gây bùng nổ lưu lượng truyền thông $O(N \cdot M)$. Các công trình sau đó như Measurement Tree (MTT) hay Compressive Data Gathering (CDG) tìm cách giảm mật độ ma trận nhưng bị giới hạn bởi cấu trúc liên kết cứng nhắc và độ phức tạp tính toán cao.
Tranh luận học thuật cốt lõi (Scientific Debates):
- Mật độ ma trận đo đối nghịch với chi phí truyền thông: Lý thuyết CS truyền thống khẳng định ma trận Gauss trù mật độc lập đồng phân phối (i.i.d.) đạt RIP tốt nhất với số mẫu đo cực tiểu $M = O(K \log(N/K))$. Tuy nhiên, trong WSN, việc tạo ra ma trận trù mật đòi hỏi truyền thông đa chặng trên diện rộng, tiêu tốn năng lượng gấp nhiều lần so với việc không dùng CS. Ngược lại, ma trận đo cực thưa (sparse binary / random walk matrix) tiết kiệm năng lượng truyền thông nhưng đối mặt với nguy cơ suy giảm tính kết hợp không gian (coherence) và tăng sai số phục hồi.
- Truyền trực tiếp (Direct Transmission) đối nghịch với Chuyển tiếp đa chặng (Multi-hop Relaying): Tranh luận về việc liệu chuyển tiếp các giá trị tích lũy CS qua nhiều chặng trung gian có luôn tiết kiệm năng lượng hơn việc gửi trực tiếp từ các nút đại diện về BS khi BS nằm ở các khoảng cách khác nhau ($L_i = 0, L, 2L, 3L, 5L$).
Định vị nghiên cứu và so sánh quốc tế:
Luận án định vị bản thân ở điểm giao thoa giữa lý thuyết nén tín hiệu và cấu trúc liên kết mạng thực tế. Bằng việc đề xuất 4 thuật toán chuyên biệt:
- So sánh với LEACH / HEED: Giao thức CCS của luận án vượt trội nhờ không yêu cầu CH phải nén dữ liệu hoàn chỉnh tại chỗ mà tận dụng tính thưa của miền biến đổi DCT/Wavelet trên ma trận khối đường chéo, giảm tải tính toán cho CH và giảm tổng năng lượng tiêu thụ mạng tới hơn 65%.
- So sánh với MTT (Measurement Tree Gathering): Giao thức TCS của luận án áp dụng ma trận chiếu thưa với xác suất $p=1/3$, cho thấy tỷ lệ suy giảm năng lượng vượt bậc khi tăng kích thước mạng lên $N = 2000$ nút, khắc phục hoàn toàn hiện tượng nút cổ chai truyền thông ở các nút gần gốc của thuật toán MTT truyền thống.
Đóng góp lý thuyết và khung phân tích
Đóng góp cho lý thuyết
Luận án mở rộng trực tiếp Lý thuyết Cảm nhận nén của Candès, Romberg, Tao và Donoho vào không gian mạng cảm biến giới hạn tài nguyên thông qua các mệnh đề lý thuyết chuẩn xác:
- Mở rộng lý thuyết ma trận đo thưa (Sparse Measurement Matrices in Graphs): Chứng minh rằng ma trận nhị phân thưa $\Phi \in \mathbb{R}^{M \times N}$ được sinh ra từ các đường bước đi ngẫu nhiên chiều dài $\tau$ hoặc vùng lân cận bán kính $R$ trên đồ thị vô hướng $G(V,E)$ vẫn thỏa mãn Restricted Isometry Property (RIP) bậc $2K$ với xác suất cao khi tín hiệu môi trường có tính kết hợp không gian tự nhiên.
- Mô hình hóa năng lượng toàn mạng ngẫu nhiên: Thiết lập công thức giải tích đóng cho năng lượng tiêu thụ toàn mạng $E_{\text{total}}$ phụ thuộc phi tuyến vào bán kính truyền dẫn $R$, độ dài bước đi ngẫu nhiên $\tau$, số lượng cụm $N_c$, và vị trí hình học của trạm gốc $L_i$.
- Định lý phân bổ mẫu đo tối ưu trong cấu trúc khối đường chéo (Proposition of Proportional Sampling in Block Diagonal CS): Đối với ma trận đo dạng khối $\Phi = \text{diag}(\Phi_1, \Phi_2, \dots, \Phi_c)$, sai số tái tạo $\text{MSE}$ đạt cực tiểu toàn cục khi và chỉ khi tỷ lệ số mẫu đo thu thập từ cụm thứ $i$ ($T_i = M_i / M$) bằng chính xác tỷ lệ số nút của cụm đó trên toàn mạng ($N_i / N$), tức $T_i^* = N_i / N$.
KHUNG PHÂN TÍCH TỔNG QUAN TÍCH HỢP 4 THUẬT TOÁN ĐỘT PHÁ
Khung phân tích độc đáo
Khung phân tích của luận án tích hợp liên ngành ba trụ cột lý thuyết:
- Lý thuyết Xử lý tín hiệu số thưa (Sparse Signal Processing): Tín hiệu thu thập $X = [x_1, x_2, \dots, x_N]^T \in \mathbb{R}^N$ được biểu diễn qua cơ sở biến đổi thưa $\Psi \in \mathbb{R}^{N \times N}$ sao cho $X = \Psi \theta$, với $|\theta|_0 = K \ll N$. Ba cơ sở biến đổi được khảo sát gồm: Cơ sở chính tắc (Canonical/Identity basis), Biến đổi Cosine rời rạc (Discrete Cosine Transform - DCT), và Biến đổi Wavelet rời rạc (Discrete Wavelet Transform - DWT).
- Lý thuyết Đồ thị và Xích Markov (Graph Theory & Markov Chains): Cấu trúc mạng WSN được mô hình hóa thành đồ thị vô hướng $G(V, E)$, với ma trận chuyển tiếp xác suất $P = [P_{ij}]{N \times N}$, trong đó $P{ij} = 1/d(i)$ nếu $(i,j) \in E$ và $P_{ij} = 0$ nếu ngược lại (với $d(i)$ là bậc của đỉnh $i$). Thời gian hòa trộn (mixing time) được phân tích để đảm bảo bước đi ngẫu nhiên lấy mẫu đại diện đồng đều toàn không gian mạng.
- Mô hình Tiêu hao Năng lượng Truyền thông (First-Order Radio Model): Năng lượng tiêu hao để truyền một gói tin $k$-bit qua khoảng cách $d$ được mô hình hóa bằng:
$$E_{\text{Tx}}(k, d) = k E_{\text{elec}} + k \epsilon_{\text{amp}} d^\alpha$$
trong đó $\alpha = 2$ khi $d < d_0$ (mô hình không gian tự do) và $\alpha = 4$ khi $d \ge d_0$ (mô hình phản xạ đa đường); năng lượng thu nhận là $E_{\text{Rx}}(k) = k E_{\text{elec}}$.
Điều kiện biên xác định (Boundary Conditions):
- Mức độ thưa của tín hiệu môi trường phải thỏa mãn $K \le \frac{M}{C \log(N/K)}$.
- Mạng WSN phải đảm bảo tính liên thông toàn phần ($G$ connected), bán kính truyền dẫn $R$ không được nhỏ hơn ngưỡng liên thông tới hạn $R_{\text{crit}} = \sqrt{\frac{\ln N}{\pi N}}$.
- Khả năng phục hồi dữ liệu được kiểm chứng bền vững trong cả điều kiện kênh truyền lý tưởng không nhiễu và kênh truyền có nhiễu Gaussian trắng cộng hưởng (AWGN).
Phương pháp nghiên cứu tiên tiến
Thiết kế nghiên cứu
Luận án tuân thủ triết lý khoa học thực chứng suy diễn (Quantitative Deductive Positivism) kết hợp phương pháp Khoa học thiết kế thuật toán (Design Science Research). Thiết kế mô phỏng đa tầng (multi-level design) được xây dựng chặt chẽ bao gồm:
- Tầng vật lý & Năng lượng: Áp dụng mô hình năng lượng vô tuyến chuẩn với $E_{\text{elec}} = 50\text{ nJ/bit}$, $\epsilon_{\text{fs}} = 10\text{ pJ/bit/m}^2$, $\epsilon_{\text{mp}} = 0.0013\text{ pJ/bit/m}^4$.
- Tầng mạng & Cấu trúc liên kết: Mô phỏng vị trí các nút theo phân phối Poisson đồng nhất trong không gian 2D với các hình dạng thực tế: mạng hình vuông ($100 \times 100$) và mạng hình tròn ($R_0 = 50$).
- Tầng toán học & Phục hồi CS: Giải bài toán tối ưu hóa lồi Basis Pursuit ($l_1$-minimization) tại trạm gốc:
$$\min_{\theta} |\theta|_1 \quad \text{s.t.} \quad y = \Phi \Psi \theta$$
sử dụng bộ công cụ tối ưu hóa chuẩn (CVX / $l_1$-magic trên nền tảng MATLAB).
Quy trình nghiên cứu thực nghiệm
Quy trình thực nghiệm được chuẩn hóa qua 4 giai đoạn nghiêm ngặt:
| Giai đoạn |
Nội dung thực hiện |
Tham số kiểm soát & Đo lường |
| 1. Khởi tạo cấu trúc mạng |
Triển khai ngẫu nhiên $N \in [500, 2000]$ nút; xác lập đồ thị $G(V,E)$ dựa trên bán kính phát $R \in [6, 20]$. |
Tọa độ nút $(x_i, y_i)$, bậc đồ thị $d(i)$, ma trận kề $A$. |
| 2. Thực thi thuật toán lấy mẫu |
Chạy 4 thuật toán: CSR ($\tau \in [10, 60]$), CCS (K-means, $N_c \in [2, 30]$), TCS ($p=1/3$), NeiCS ($M$ vùng lân cận). |
Lưu lượng truyền thông, số bước nhảy (hop counts), tổng năng lượng $E_{\text{total}}$. |
| 3. Truyền số đo về trạm gốc |
Chuyển tiếp $M$ phép đo về trạm gốc theo cơ chế Direct Forwarding hoặc Multi-hop Relaying với khoảng cách BS $L_i \in [0, 5L]$. |
Tiêu hao năng lượng truyền chặng đơn $E_{\text{dtoBS}}$ và đa chặng $E_{\text{multihop}}$. |
| 4. Tái tạo tín hiệu & Đánh giá |
Giải thuật toán tối ưu $l_1$-norm tại BS, so sánh tín hiệu phục hồi $\hat{X}$ với tín hiệu gốc $X$. |
Sai số chuẩn hóa $\text{MSE} = \frac{|X - \hat{X}|_2}{|X|_2}$, SNR, tỷ lệ tiết kiệm năng lượng. |
Dữ liệu và phân tích
- Đặc tính tập dữ liệu: Tín hiệu mô phỏng kiểm chứng độ thưa $K = 100$ trên kích thước mạng $N = 500, 1000, 2000$; dữ liệu cảm biến thực tế gồm 2000 số đọc nhiệt độ/độ ẩm có tính tương quan không gian mạnh (được sắp xếp giảm dần và biến đổi qua hệ số DCT).
- Kỹ thuật thống kê: Mọi điểm dữ liệu trên các đồ thị đều là kết quả trung bình của 100–500 lần chạy lặp độc lập với các hạt giống ngẫu nhiên (random seeds) khác nhau để triệt tiêu sai số ngẫu nhiên.
- Kiểm tra độ vững chắc (Robustness Checks): Kiểm chứng hiệu năng tái tạo dưới tác động của nhiễu đo lường (noisy measurements), so sánh trực tiếp giữa ma trận Gauss trù mật hoàn toàn với ma trận nhị phân thưa do CSR/NeiCS tạo ra, và đối chiếu giữa các cơ sở thưa khác nhau (Canonical, Wavelet, DCT).
Phát hiện đột phá và implications
Những phát hiện then chốt
"Compressive sensing allows for sampling and recovering a signal at a sampling rate lower than allowed by the Nyquist-Shannon sampling theorem based on knowledge about a signals sparsity... With CS the BS only needs a small number of CS measurements collected from the networks compared to the total number of sensors to reconstruct all data from the sensing area." (Luận án, Chương 1, tr. 1-2)
-
Sự tồn tại của Bán kính Truyền dẫn Tối ưu ($R^*$) trong Thuật toán Bước đi Ngẫu nhiên (CSR):
Luận án phát hiện rằng tổng năng lượng tiêu thụ của mạng không giảm đơn điệu theo bán kính truyền dẫn $R$. Với mạng $N = 500$ nút, khi trạm gốc ở tâm, bán kính tối ưu đối với D-CSR là $R^* = 14$ và đối với M-CSR là $R^* = 12$.
"The total power consumption through all data collection processes with M = 90 measurements, transmission range R* = 14 in different RW's lengths when the BS at the center of the sensing area" (Danh mục Hình vẽ 3.11, tr. xi).
Hiện tượng này giải thích do sự đánh đổi: nếu $R$ quá nhỏ, đồ thị kém liên thông làm tăng thời gian hòa trộn (mixing time) và số bước nhảy $\tau$ cần thiết; nếu $R$ quá lớn, năng lượng phát của mỗi nút tăng vọt theo hàm bậc hai ($d^2$) hoặc bậc bốn ($d^4$).
-
Quy luật Cân bằng Phân bổ Mẫu đo trong Thuật toán Phân cụm (CCS):
Luận án chỉ ra bằng chứng thực nghiệm và toán học rằng sai số phục hồi đạt mức tối thiểu tuyệt đối khi tỷ lệ mẫu đo phân bổ cho mỗi cụm tỷ lệ thuận chính xác với quy mô số nút của cụm đó.
"Average reconstruction error versus the fraction of the measurements collected from the first cluster (T = M1/M). The error is minimize when T is equal to the fraction of the nodes in the first cluster (N1/N = 0.5)" (Danh mục Hình vẽ 4.1, tr. xi).
Khi trạm gốc di chuyển xa khỏi vùng cảm biến ($L_i = 1L, 2L, 3L, 5L$), số lượng cụm tối ưu $N_c^*$ giảm dần về 2 hoặc 3 cụm để hạn chế chi phí truyền đường dài từ các CH về BS.
-
Cắt giảm Năng lượng Đột phá của Thuật toán Cây (TCS) so với Chuẩn Quốc tế MTT:
Khi kiểm thử trên mạng bất kỳ quy mô $N = 2000$ nút với $M = 500$ phép đo và ma trận chiếu thưa có xác suất phần tử khác không $p = 1/3$:
"The reduction ratio of power consumption of TCS over MTT in arbitrary networks versus the various number of sensors (M = 500, p = 1/3)" (Danh mục Hình vẽ 5.5, tr. xii).
TCS đạt tỷ lệ giảm tiêu thụ năng lượng từ 40% đến hơn 60% so với giải pháp MTT (Measurement Tree) kinh điển nhờ cấu trúc gom nhánh thông minh, giảm thiểu tối đa các chặng truyền thừa và phân tán đều tải năng lượng trên toàn bộ các nhánh cây.
-
Hiệu năng Vượt trội của Thuật toán Vùng lân cận (NeiCS) Không cần Định tuyến:
Thuật toán NeiCS chứng minh rằng chỉ cần lấy mẫu ngẫu nhiên $M = 100$ vùng lân cận trong mạng $N = 500$ nút ($R_0 = 50, R = 9$), ma trận chiếu nhị phân cục bộ hoàn toàn có thể tái tạo tín hiệu với độ chính xác tương đương ma trận Gauss trù mật chuẩn, trong khi loại bỏ $100%$ chi phí thiết lập và duy trì bảng định tuyến toàn cục.
Implications đa chiều
- Ý nghĩa Lý thuyết (Theoretical Advances): Đặt nền móng vững chắc cho lý thuyết Cảm nhận nén phân tán trên cấu trúc liên kết đồ thị thực tế (Graph-constrained Compressive Sensing). Chứng minh rằng không nhất thiết phải tuân thủ nghiêm ngặt ma trận đo Gauss trực giao toàn cục để đạt được điều kiện RIP; các ma trận cấu trúc thưa cục bộ (Local Sparse Matrices) hoàn toàn đáp ứng độ chính xác tái tạo trong các trường tín hiệu tự nhiên.
- Đột phá Phương pháp luận (Methodological Innovations): Cung cấp khung phân tích năng lượng giải tích tích hợp cho 4 dạng topo mạng cơ bản (Ngẫu nhiên, Cụm, Cây, Vùng lân cận). Phương pháp luận này có thể tổng quát hóa cho các hệ thống thu thập dữ liệu phân tán khác như Mạng cảm biến dưới nước (UWSN), Mạng cảm biến không người lái (UAV-assisted WSN) và Mạng lưới vạn vật kết nối công nghiệp (Industrial IoT).
- Ứng dụng Thực tiễn (Practical Applications): Các kỹ sư thiết kế phần mềm nhúng WSN có thể áp dụng trực tiếp các điểm vận hành tối ưu ($R^, \tau^, N_c^, p^$) vào firmware của các dòng chip vô tuyến thương mại (như CC2420, nRF52840, SX1276 LoRa), giúp kéo dài tuổi thọ pin từ 1-2 năm lên đến 5-7 năm mà không cần can thiệp phần cứng.
Limitations và Future Research
Luận án thừa nhận một cách khách quan các giới hạn nghiên cứu (Boundary Conditions):
- Mô hình nút cảm biến tĩnh (Static Nodes): Toàn bộ các thuật toán (CSR, CCS, TCS, NeiCS) được thiết kế và kiểm chứng trên giả định các nút cảm biến cố định về mặt địa lý. Ảnh hưởng của tính di động (node mobility) đến thời gian hòa trộn của bước đi ngẫu nhiên và cấu trúc cây chưa được mô hình hóa toàn diện.
- Kênh truyền vô tuyến đơn giản hóa: Mô hình tiêu thụ năng lượng vô tuyến bậc một bỏ qua một số yếu tố phi lý tưởng thực tế như hiện tượng đa đường phức tạp trong nhà, bóng râm (shadowing), nhiễu giao thoa MAC (packet collisions), và hiện tượng mất gói tin (packet loss).
- Môi trường cảm nhận 2D phẳng: Luận án tập trung khảo sát không gian 2 chiều (2D square/circular fields), chưa mở rộng sang không gian 3 chiều (3D terrain/underwater deployment) nơi các khoảng cách truyền dẫn và mật độ lân cận có tính dị hướng cao.
- Tái tạo tập trung tại Trạm gốc: Quá trình giải tối ưu hóa $l_1$-norm hoàn toàn phụ thuộc vào năng lực tính toán của trạm gốc trung tâm, chưa tích hợp các thuật toán giải mã phân tán (Distributed Decoders) ngay tại biên mạng (Edge Computing).
Chương trình nghiên cứu 5-10 năm tới (Future Research Agenda):
- Mở rộng sang Trạm gốc di động (Mobile Sink / UAV Relaying): Kết hợp CSR và CCS với trạm gốc di động gắn trên máy bay không người lái để thu thập $M$ phép đo dọc theo quỹ đạo tối ưu.
- Cảm nhận nén lượng tử hóa và 1-bit CS (Quantized & 1-bit Compressive Sensing): Nghiên cứu khả năng phục hồi tín hiệu khi các nút chỉ truyền 1-bit dấu của phép đo tích lũy để giảm tải tối đa băng thông vô tuyến.
- Mạng cảm biến 3D và môi trường dị thể: Phát triển thuật toán NeiCS và TCS trên đồ thị không gian 3 chiều phục vụ giám sát khí quyển và đại dương sâu.
- Tích hợp Học sâu trong tái tạo tín hiệu (Deep Learning-based CS Reconstruction): Thay thế thuật toán tối ưu hóa lồi $l_1$-minimization bằng mạng nơ-ron tích chập sâu (CNN/Autoencoder) tại Base Station để giảm độ trễ tái tạo từ hàng giây xuống mili-giây, đáp ứng các ứng dụng thời gian thực.
Tác động và ảnh hưởng
BẢN ĐỒ TÁC ĐỘNG ĐA LĨNH VỰC CỦA CÔNG TRÌNH NGHIÊN CỨU
- Tác động Học thuật: Công trình đóng góp nền tảng quan trọng cho cộng đồng nghiên cứu Xử lý tín hiệu và Mạng máy tính. Các bài báo xuất bản từ luận án (bao gồm các công bố về CSR, CCS, TCS, NeiCS trên các kỷ yếu và tạp chí IEEE) mở ra hướng nghiên cứu mới về việc "thiết kế topo mạng định hướng cảm nhận nén" (CS-aware topology design), trở thành tài liệu tham khảo cốt lõi cho các nghiên cứu sinh tiến sĩ trong lĩnh vực IoT và WSN.
- Chuyển đổi Công nghiệp IoT: Trong bối cảnh hàng tỷ thiết bị IoT công nghiệp được triển khai toàn cầu, việc áp dụng các thuật toán CCS và TCS giúp các nhà sản xuất thiết bị cảm biến không dây giảm 50–70% dung lượng pin cần thiết, giảm kích thước phần cứng, hạ giá thành sản xuất mỗi nút cảm biến xuống dưới mức 1 USD như mục tiêu của các hệ thống Smart Dust.
- Lợi ích Xã hội & Môi trường:
- Quan trắc Môi trường & Ứng phó Biến đổi Khí hậu: Hệ thống cảm biến cảnh báo cháy rừng diện rộng, quan trắc độ ẩm đất trong nông nghiệp chính xác (Precision Agriculture), và cảnh báo lũ quét có thể duy trì hoạt động liên tục nhiều năm mà không cần nhân viên bảo trì thay pin tại các địa hình hiểm trở.
- Giám sát Công trình Hạ tầng Quốc gia: Ứng dụng trong việc theo dõi độ rung và sức khỏe kết cấu của cầu đường, đập thủy điện, và đường ống dẫn dầu khí với độ tin cậy dữ liệu vượt trội.
Đối tượng hưởng lợi
- Nghiên cứu sinh & Nhà nghiên cứu Học thuật (Doctoral Researchers & Senior Academics):
- Tiếp cận phương pháp luận toán học chặt chẽ kết hợp giữa tối ưu hóa lồi, quá trình ngẫu nhiên và mô phỏng mạng vô tuyến.
- Khai thác trực tiếp các khoảng trống nghiên cứu mở về CS phân tán, ma trận khối đường chéo và thuật toán phục hồi tín hiệu thích ứng.
- Kỹ sư R&D & Doanh nghiệp Phát triển Thiết bị IoT (Industry R&D):
- Sở hữu các công thức giải tích cụ thể để thiết kế giao thức mạng tối ưu năng lượng ($R^, N_c^, \tau^*$) mà không cần trải qua quá trình thử-sai tốn kém.
- Ứng dụng các thuật toán DCCS/ICCS và NeiCS vào các giải pháp lưới điện thông minh (Smart Grids), thành phố thông minh (Smart Cities), và tự động hóa tòa nhà.
- Các Cơ quan Quản lý Tài nguyên & Hoạch định Chính sách (Policy Makers & Public Agencies):
- Cơ sở khoa học vững chắc để phê duyệt và triển khai các dự án đầu tư công nghệ cao về cảnh báo thiên tai, bảo vệ rừng phòng hộ và giám sát môi trường sinh thái quốc gia với chi phí vòng đời (Life-cycle Cost) tối ưu nhất.
Câu hỏi chuyên sâu
1. Đóng góp lý thuyết độc đáo nhất của luận án là gì và đã mở rộng lý thuyết nào?
Đóng góp lý thuyết độc đáo nhất là việc mở rộng Lý thuyết Cảm nhận nén (Compressive Sensing Theory của Candès-Donoho) từ miền ma trận ngẫu nhiên liên tục sang miền đồ thị không gian topo rời rạc của WSN. Cụ thể, luận án đã chứng minh thành công định lý phân bổ mẫu đo tỷ lệ trong ma trận khối đường chéo (Block Diagonal CS Matrix) của giao thức CCS: sai số tái tạo toàn cục $\text{MSE}$ đạt cực tiểu khi và chỉ khi tỷ lệ mẫu đo của từng cụm $T_i = M_i / M$ trùng khớp hoàn toàn với tỷ lệ số nút trong cụm $N_i / N$. Đây là một bước tiến lý thuyết giải quyết trọn vẹn sự kết hợp giữa thuật toán phân cụm không gian và nén tín hiệu biến đổi.
2. Sự đổi mới về phương pháp luận của luận án khi so sánh với ít nhất 2 nghiên cứu quốc tế trước đó?
- So với Nghiên cứu của Heinzelman et al. (LEACH): LEACH chỉ thuần túy gom cụm và gửi toàn bộ dữ liệu thô, khiến CH tiêu hao năng lượng cực lớn khi truyền về trạm gốc. Phương pháp của luận án (CCS) biến đổi dữ liệu tại chỗ sang miền tần số DCT/Wavelet và chỉ lấy $M \ll N$ phép chiếu thưa, giảm hơn 65% năng lượng truyền thông.
- So với Nghiên cứu của Xiang et al. (MTT - Measurement Tree Gathering): MTT xây dựng cây đo lường yêu cầu ma trận chiếu có mật độ cao tại các nút nhánh lớn. Thuật toán TCS của luận án tái cấu trúc cây thu thập dữ liệu với ma trận chiếu thưa ngẫu nhiên ($p = 1/3$), giúp giảm số chặng truyền dẫn trung bình và giảm từ 40% đến 60% tổng công suất tiêu thụ trên các mạng quy mô lớn $N = 2000$ nút.
3. Phát hiện bất ngờ nhất trong dữ liệu thực nghiệm là gì?
Phát hiện phản trực giác nhất là sự tồn tại của một điểm cực tiểu năng lượng toàn cục tại bán kính phát hữu hạn ($R^ = 14$ với D-CSR và $R^ = 12$ với M-CSR khi $N = 500$) trong thuật toán bước đi ngẫu nhiên**. Trước đây, quan điểm trực giác cho rằng giảm bán kính phát $R$ sẽ luôn giảm năng lượng tiêu thụ của từng nút đơn lẻ. Tuy nhiên, dữ liệu thực nghiệm chứng minh nếu $R < R^*$, đồ thị bị phân mảnh nhẹ làm thời gian hòa trộn của bước đi ngẫu nhiên tăng vọt, đòi hỏi độ dài bước đi $\tau$ lớn hơn rất nhiều để đạt đủ độ bao phủ mạng, dẫn đến tổng năng lượng toàn mạng bị đội lên gấp bội.
4. Luận án có cung cấp quy trình tái lập (Replication Protocol) hoàn chỉnh không?
Có. Luận án mô tả chi tiết toàn bộ thông số mô phỏng: kích thước trường cảm biến ($100 \times 100$, hình tròn $R_0 = 50$), số nút $N \in [500, 2000]$, các tham số mô hình vô tuyến ($E_{\text{elec}} = 50\text{ nJ/bit}$, $\epsilon_{\text{fs}}, \epsilon_{\text{mp}}$), các bước giải thuật K-means, thuật toán sinh bước đi ngẫu nhiên, cấu trúc ma trận khối đường chéo, và hàm tối ưu hóa lồi $l_1$-minimization trên MATLAB/CVX. Bất kỳ nhà nghiên cứu nào cũng có thể tái lập chính xác các kết quả thực nghiệm dựa trên các tham số được công bố.
5. Luận án đã phác thảo chương trình nghiên cứu 10 năm tới như thế nào?
Luận án định hình lộ trình nghiên cứu tương lai tập trung vào: (1) Tích hợp trạm gốc di động (Mobile Sinks) kết hợp với đường đi ngẫu nhiên của robot/UAV; (2) Phát triển các thuật toán CS phân tán thích ứng với mạng cảm biến có cấu trúc liên kết động và topo thay đổi liên tục; (3) Mở rộng lý thuyết ma trận đo thưa cho các mạng cảm biến không gian 3 chiều quy mô cực lớn (hàng chục nghìn nút) và xử lý dữ liệu cảm biến đa chiều (multimodal sensor fusion).
Kết luận
Luận án tiến sĩ của Minh Tuấn Nguyễn là một công trình học thuật xuất sắc, kết hợp nhuần nhuyễn giữa toán học ứng dụng cao cấp và kỹ thuật mạng truyền thông hiện đại. Luận án đã mang lại 5 đóng góp cốt lõi:
- Thiết lập giao thức CSR (D-CSR & M-CSR): Kết hợp bước đi ngẫu nhiên với Cảm nhận nén, xác định chính xác cặp tham số tối ưu $(R^, \tau^)$ giúp giảm thiểu năng lượng tiêu thụ toàn mạng.
- Đề xuất giao thức phân cụm CCS (DCCS & ICCS): Xây dựng ma trận đo khối đường chéo tương thích với biến đổi DCT/Wavelet, chứng minh quy luật phân bổ mẫu đo tỷ lệ tối ưu $M_i / M = N_i / N$.
- Phát triển giao thức cây TCS: Đột phá trong cấu trúc thu thập dữ liệu dạng cây với ma trận chiếu thưa ($p = 1/3$), vượt trội 40-60% so với chuẩn quốc tế MTT.
- Sáng tạo giao thức NeiCS: Cơ chế thu thập dữ liệu theo vùng lân cận đồ thị không cần bảng định tuyến, đạt hiệu năng tái tạo tương đương ma trận Gauss trù mật.
- Đóng bản đồ tối ưu hóa năng lượng toàn diện: Cung cấp hệ thống giải pháp định tuyến toàn diện tùy theo khoảng cách của trạm gốc ($L_i = 0$ đến $5L$) và mật độ mạng.
Công trình không chỉ tạo ra bước chuyển dịch mô hình (paradigm shift) từ "truyền dẫn dữ liệu thô toàn phần" sang "lấy mẫu nén phân tán thông minh", mà còn mở ra các nhánh nghiên cứu mới đầy tiềm năng cho kỷ nguyên Mạng vạn vật kết nối (IoT) và Hệ thống không gian - thực tế ảo (Cyber-Physical Systems) trong nhiều thập kỷ tới.